Using Instruments to profile Go programs
Fri, Sep 2, 2016Apple has a suite of instrumentation and tracing tools for performance analysis available as a part of their Xcode tooling set. In this article, we will use Instruments to record and analyze the CPU profile of a Go program.
Instruments also provide a large set of macOS-specific tracing and profiling if you have performance issues specifically on darwin.
Some of these specific profiles are:
- System trace: Collects comprehensive information about system calls, scheduling, user-kernel space transitions. (Available only on OSX.)
- System usage: Gives very detailed output about I/O system activity. (Available only on iOS.)
- File Activity: Monitors file and directory activity such as open/close, permission modifications, creation, copying and moving.
Instruments provide a rich and very easy to use UI to display profiles. I highly recommend it as an addition to existing profiler UIs and visualizers.
Now, let’s profile a Go program.
Launch the Instruments app and select “Time Profiler”.
Create a target with your Go binary and arguments and env variables you want to start the binary with. In this tutorial, I will use the following program.
go get -u github.com/rakyll/hey
We will use hey to make 10000 requests with 200 goroutines
to the target provided in the arguments.
The target I have for hey looks like what’s below.
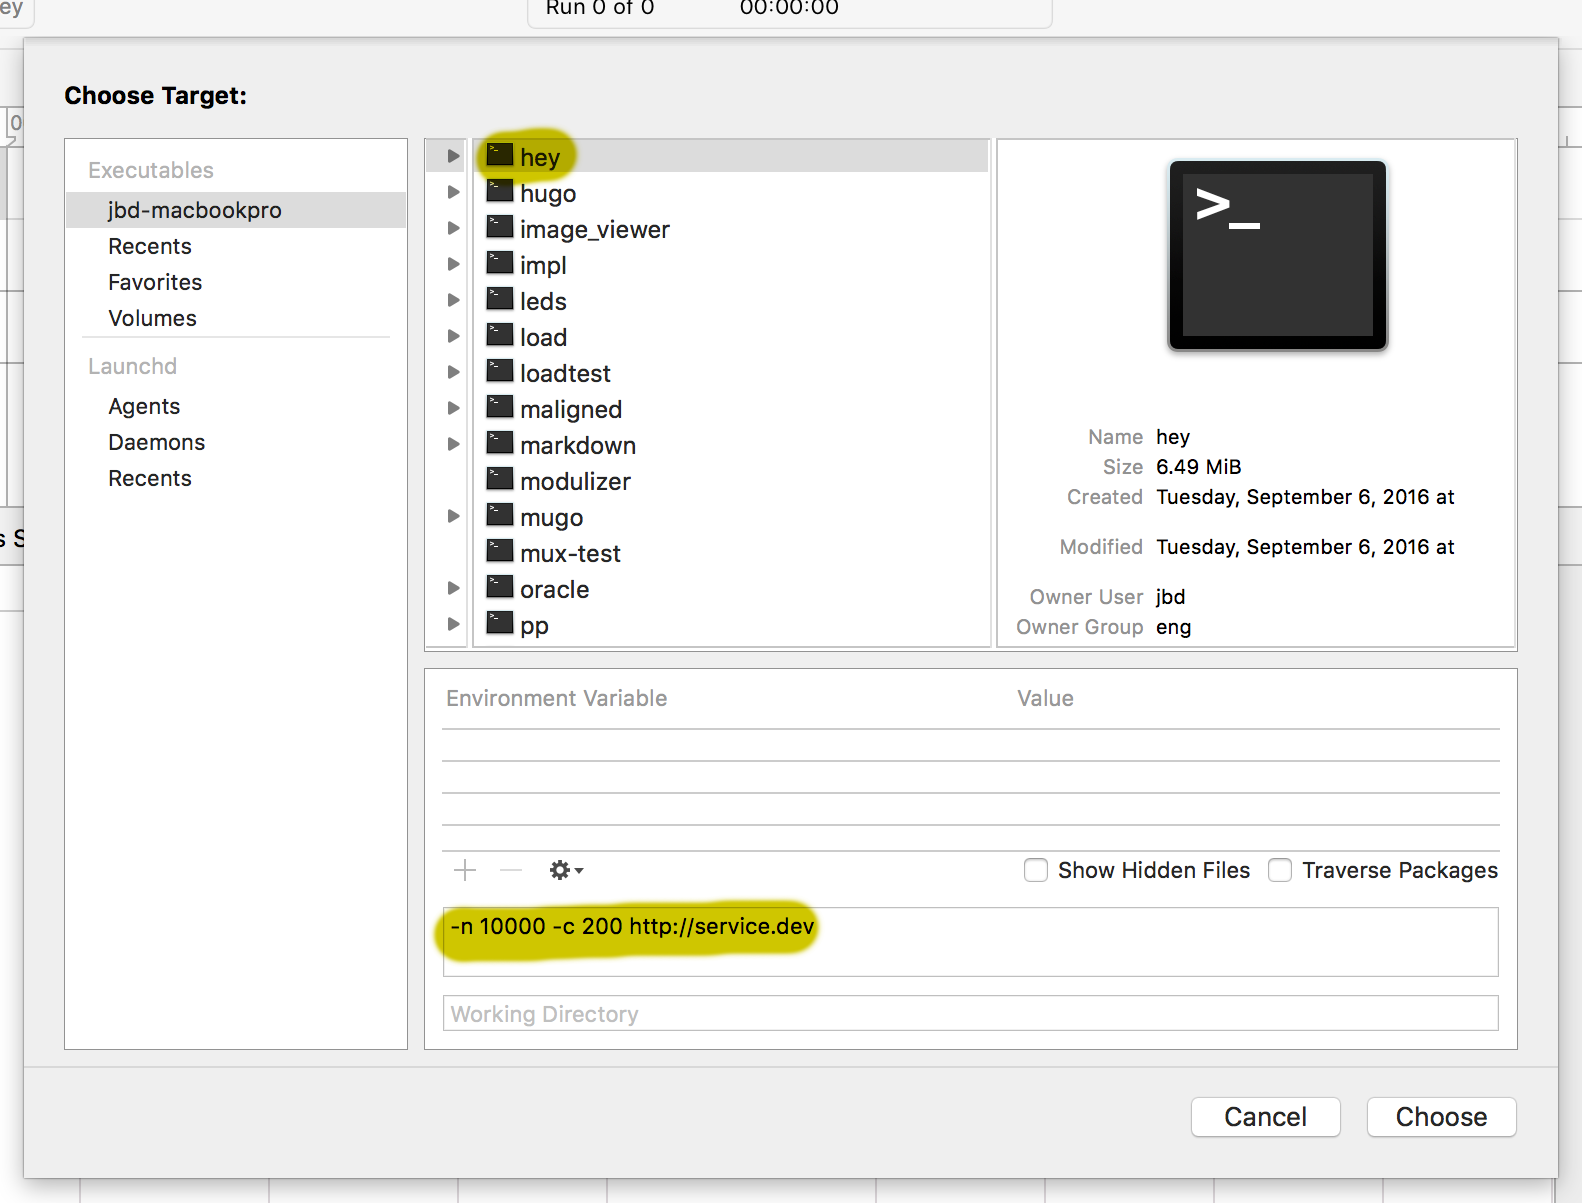
Once you have a target, you can click on the record button to start recording samples. Once enough samples are collected, stop or it will eventually stop when the program finishes.
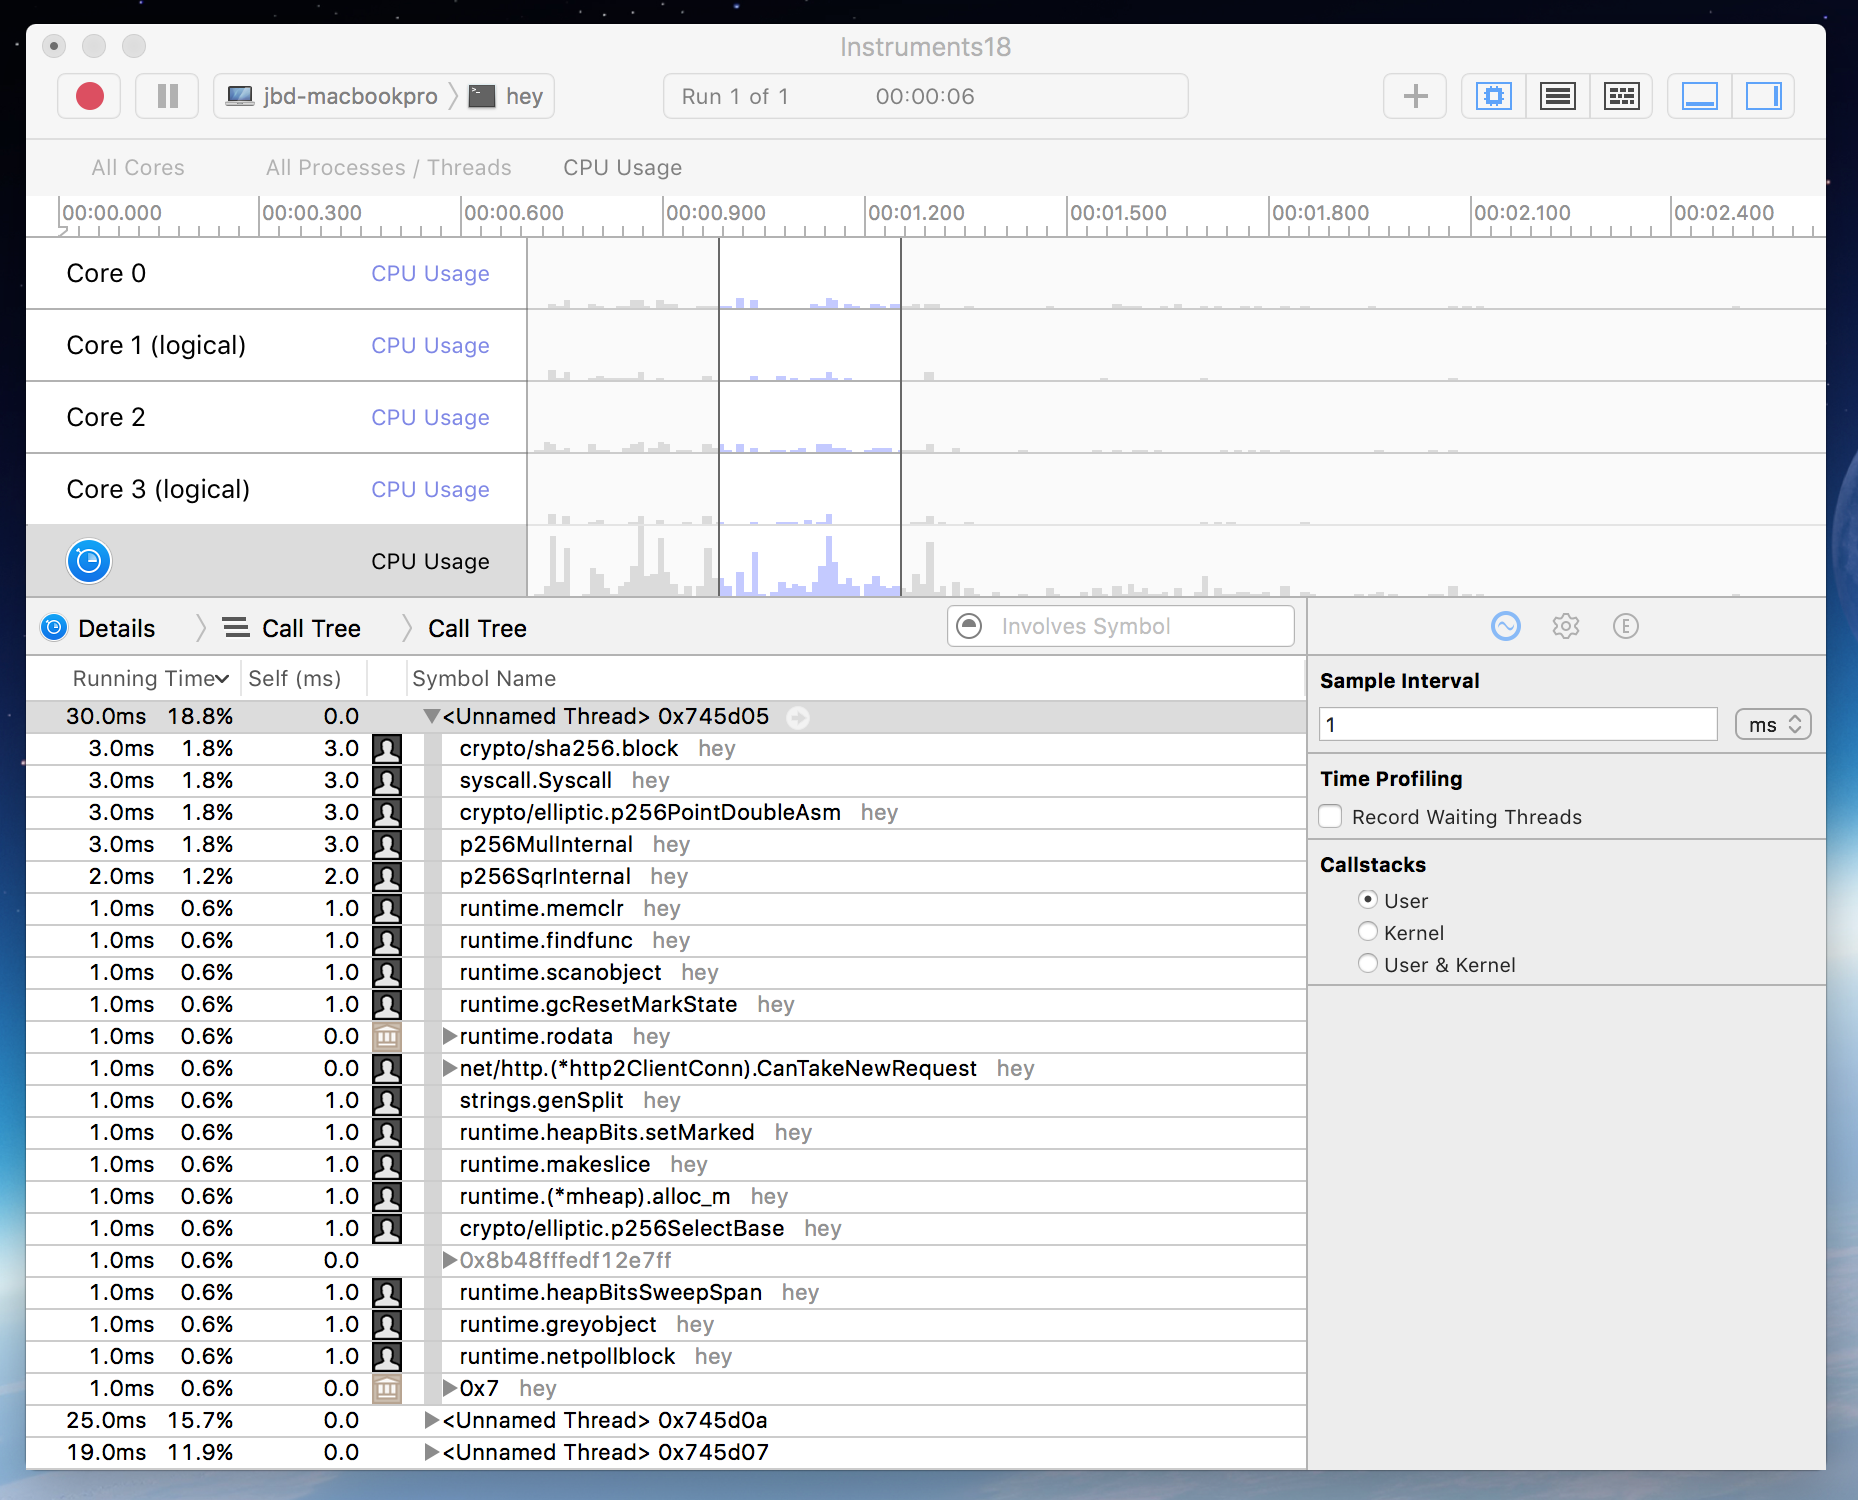
You can filter by symbol name, user vs kernel callstacks, time span, physical or logical CPU and more. You can also double click any of the symbols listed to jump to the source code.
Please note that Go programs cannot work with every profile available on Instruments. But there are a few profiles that absolutely can improve your profiling experience. With stack frame pointers enabled by default in Go 1.7, it became easier for tools like Instruments to capture backtraces more efficiently.
Happy profiling!