Profiler labels in Go
Mon, Jul 3, 2017Go 1.9 is introducing profiler labels, a way to add arbitrary key-values to the samples collected by the CPU profiler. CPU profilers collect and output hot spots where the CPU spent most time in when executing. A typical CPU profiler output is primarily reports the location of these spots as function name, source file/line, etc. By looking at the data, you can also examine which parts of the code invoked these spots. You can also filter by invokers to have more granular understanding of certain execution paths.
Even though locality information is useful to spot expensive execution paths, it is not always essentially enough when debugging a performance problem. A significant percentage of Go programmers uses Go to write servers, and it is even more complex to point out performance issues in a server. It is hard to isolate certain execution paths from others, or hard to understand whether it is only a certain path creating trouble (e.g. a user or a specific handler).
With 1.9, Go is introducing a new feature that allows you to record additional information to provide more context about the execution path. You will be able to record any set of labels, as a part of the profiling data. Then, use these labels to examine the profiler output more precisely.
You can benefit from profiler labels in many cases. Some of the obvious ones:
- You don’t want to leak your software abstractions into the examination of the profiling data; e.g. a profiling dashboard of a web server will be useful if it displays handler URL paths, rather than function names from the Go code.
- Execution stack location is not enough to understand the originator of work; e.g. a consumer that reads from a message queue does work originated somewhere else, the consumer can set labels to identify the originator.
- Context-bound information is required to debug profiling problems.
Adding labels
The runtime/pprof package will export several new APIs to let users add labels. Most users will use Do which takes a context, extends it with labels, records these labels when f is executing:
func Do(ctx context.Context, labels LabelSet, f func(context.Context))
Do only set the given label set during the execution of the current goroutine. If you want to start goroutines in f, you can propagate the labels by passing the context argument of the function.
labels := pprof.Labels("worker", "purge")
pprof.Do(ctx, labels, func(ctx context.Context) {
    // Do some work...

    go update(ctx) // propagates labels in ctx.
})
The work above will be labeled with worker:purge.
Examining the profiler output
This section will demonstrate how to examine the recorded samples by profiler labels. Once you annotate your code with labels, it is time to profile and consume the profiler data with tag filters.
I will use the net/http/pprof package to capture samples in this demo, see the Profiling Go programs article for more options.
package main

import _ "net/http/pprof"

func main() {
    // All the other code...
    log.Fatal(http.ListenAndServe("localhost:5555", nil))
}
Collect some CPU samples from the server.
$ go tool pprof http://localhost:5555/debug/pprof/profile
Once the interactive mode starts, you can list the recorded labels by the tags command. Note that pprof tools call them tags even though they are named labels in the Go standard library.
(pprof) tags
http-path: Total 80
        70 (87.50%): /messages
        10 (12.50%): /user

worker: Total 158
       158 (  100%): purge
As you can see, there are two label keys (http-path, worker) and several values recorded for each. http-path key is coming from HTTP handlers I annotated, and worker:purge is originated at the code above.
By filtering by labels, we can focus only on the samples collected from the /user handler.
(pprof) tagfocus="http-path:/user"
(pprof) top10 -cum
Showing nodes accounting for 0.10s, 3.05% of 3.28s total
      flat  flat%   sum%        cum   cum%
         0     0%     0%      0.10s  3.05%  main.generateID.func1 /Users/jbd/src/hello/main.go
     0.01s   0.3%   0.3%      0.08s  2.44%  runtime.concatstring2 /Users/jbd/go/src/runtime/string.go
     0.06s  1.83%  2.13%      0.07s  2.13%  runtime.concatstrings /Users/jbd/go/src/runtime/string.go
     0.01s   0.3%  2.44%      0.02s  0.61%  runtime.mallocgc /Users/jbd/go/src/runtime/malloc.go
         0     0%  2.44%      0.02s  0.61%  runtime.slicebytetostring /Users/jbd/go/src/runtime/string.go
         0     0%  2.44%      0.02s  0.61%  strconv.FormatInt /Users/jbd/go/src/strconv/itoa.go
         0     0%  2.44%      0.02s  0.61%  strconv.Itoa /Users/jbd/go/src/strconv/itoa.go
         0     0%  2.44%      0.02s  0.61%  strconv.formatBits /Users/jbd/go/src/strconv/itoa.go
     0.01s   0.3%  2.74%      0.01s   0.3%  runtime.memmove /Users/jbd/go/src/runtime/memmove_amd64.s
     0.01s   0.3%  3.05%      0.01s   0.3%  runtime.nextFreeFast /Users/jbd/go/src/runtime/malloc.go
The listing contains only samples labeled with http-path:/user. So we can easily understand the most expensive execution paths from the user handler.
You can also use tagshow, taghide, and tagignore commands as other filtering options. For example, tagignore allows you to match anything but the given regex. The filter below will match anything but the user handler; worker:purge and http-path:/messages in this case.
(pprof) tagfocus=
(pprof) tagignore="http-path:/user"
(pprof) tags
http-path: Total 70
        70 (  100%): /messages

worker: Total 158
       158 (  100%): purge
If you visualize the filtered samples, the output will show how much each label is contributing to the final cost.
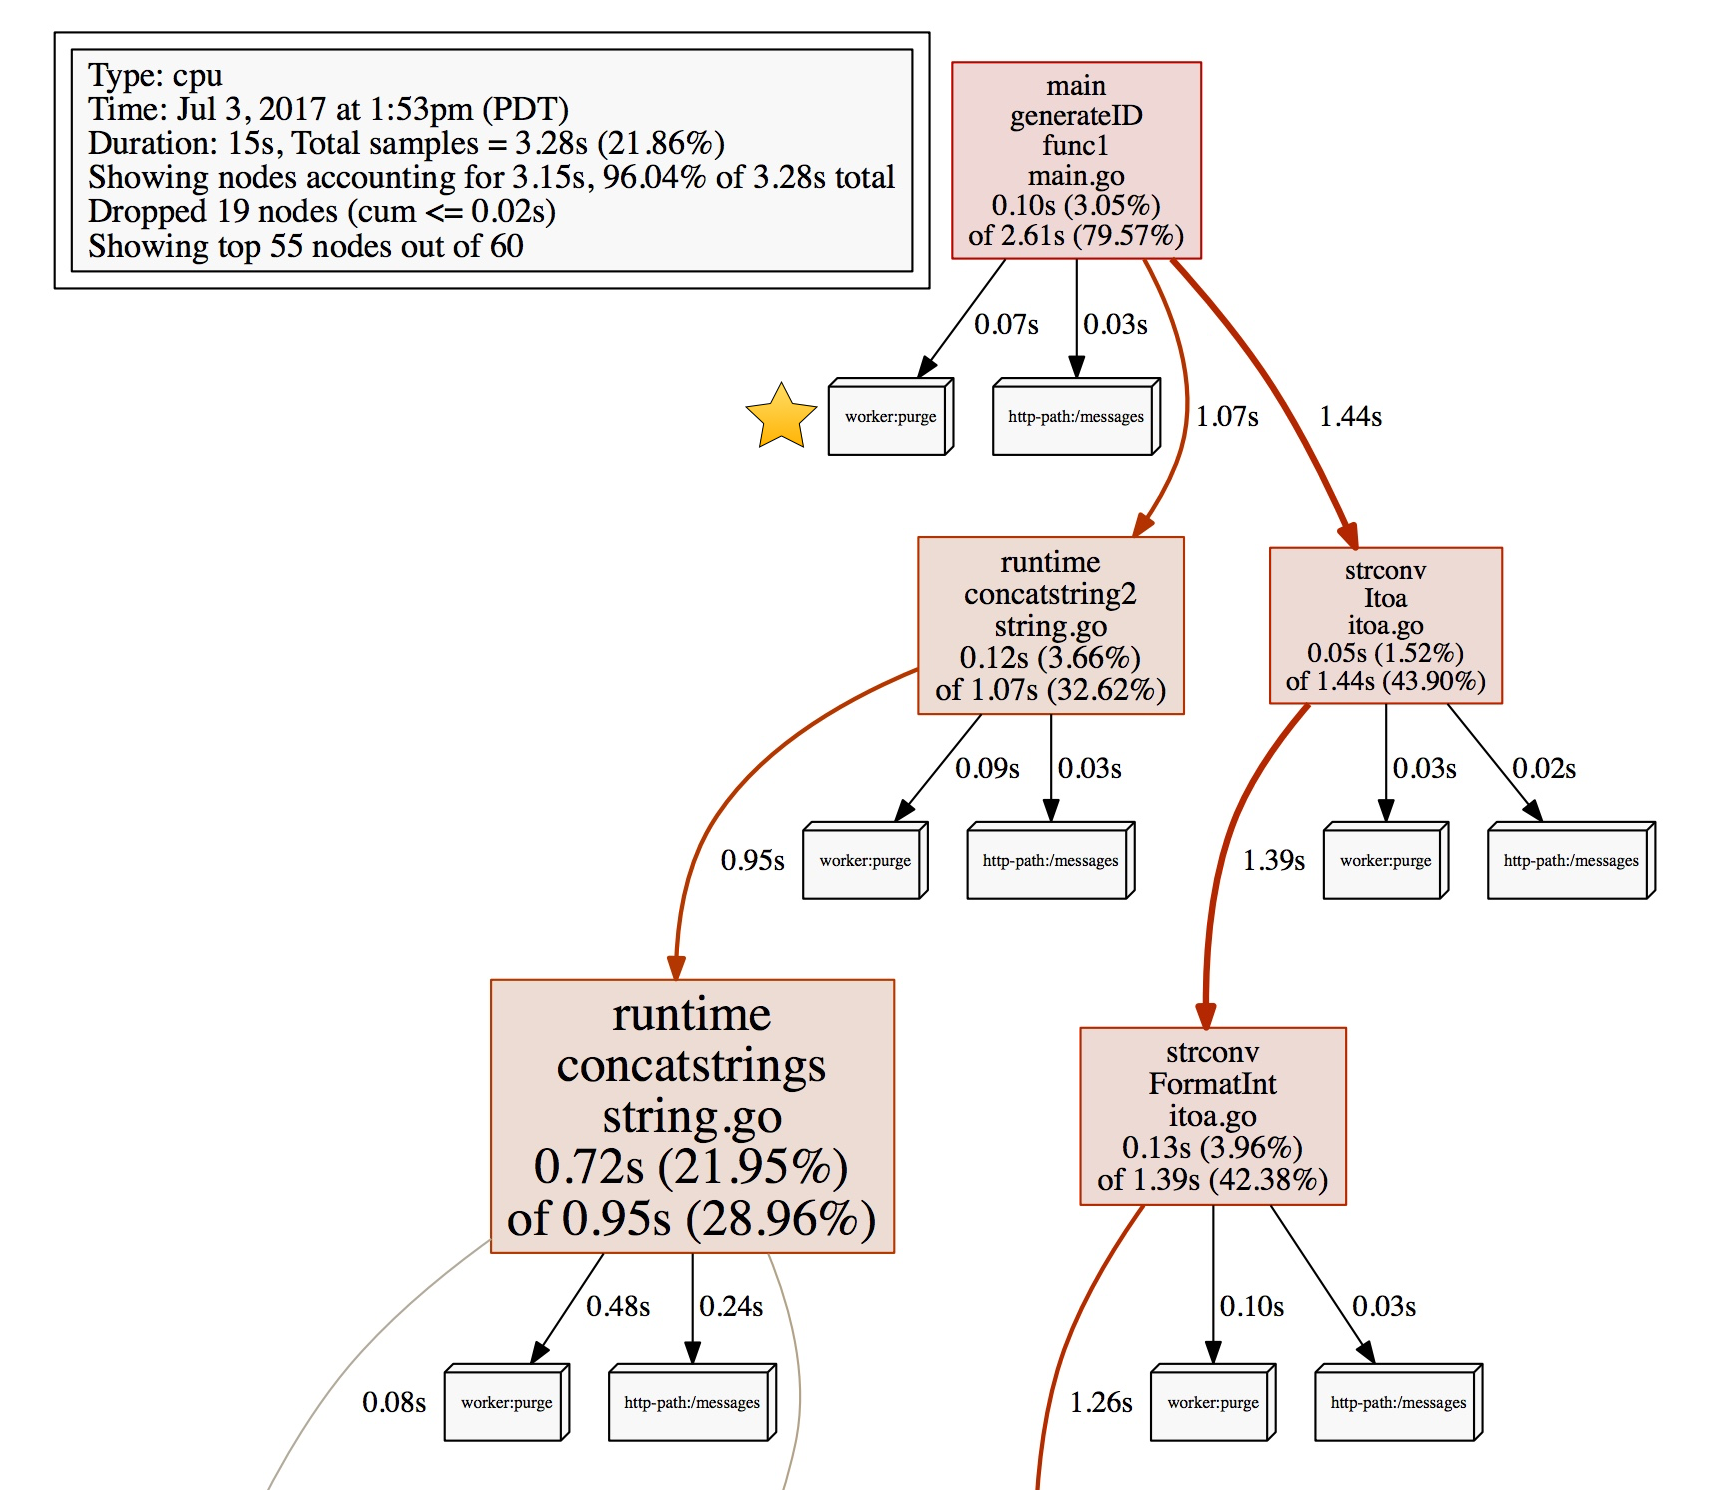
You can see that worker:purge used 0.07s, and messages handler used 0.03s in the generateID function during the collection of the profiling data.
Try it yourself!
Profiler labels allows us to add additional information to the profiler data that is not available at the current execution stack. Try them by downloading the Go 1.9 beta if you need more dimensions in your profiler output. Also, try the pprofutil package to automatically add HTTP path label to your handlers.