Mon, Dec 20, 2021
Go 1.18 is going to be released with generics support. Adding generics to Go was a multi-year effort and was a difficult one. Go type system is not a traditional type system and it was not possible just to bring an existing generics implementation from other language and be done. The current proposal was accepted after years of user research, experiments and discussions. The proposal got iterated a few times during the implementation phase. I found the final result delightful.
The proposal notes several limitations of the current implementation. When I was first reviewing the proposal a year ago, one limitation stood out the most: no parameterized methods. As someone who has been maintaining various database clients for Go, the limitation initially sounded as a major compromise. I spent a week redesigning our clients based on the new proposal but felt unsatisfied. If you are coming from another language to Go, you might be familiar with the following API pattern:
// NOTE: NOT POSSIBLE TO COMPILE THIS CODE AT THE MOMENT.

db, err := database.Connect("....")
if err != nil {
    log.Fatal(err)
}

all, err := db.All[Person](ctx) // Reads all person entities
if err != nil {
    log.Fatal(err)
}
Once you open a connection, you can share among entity types by writing generic
methods that have access to the connection. We often see this pattern implemented as generic methods, and not being able to compile the snippet above felt unideal to achieve a similar result.
Being able to write generic method bodies in cases like above are useful for framework
developers to handle boilerplate and common tasks in the framework while keeping
the implementation generic from entity types.
Facilitators
If you are looking into the Go generics for the first time, it may not be
immediately clear at first that the language allows to have parameterized receivers. Parameterized receivers
are a useful tool and helped me develop a common pattern, facilitators, to overcome the shortcomings of having no parameterized methods. Facilitators are simply
a new type that has access to the type you wished you had generic methods on. For example, if you are an ORM framework designer and want to provide
several methods of querying a table, you introduce an intermediate type, Querier, and do the wiring to Client via NewQuerier. Then, Querier allows you to write generic querying functions against types provided by your users. I found it useful to keep the facilitators in the same package to have full access to unexported fields but it’s
not necessarily.
package database

type Client struct{ ... }

type Querier[T any] struct {
	client *Client
}

func NewQuerier[T any](c *Client) *Querier[T] {
	return &Querier[T]{
		client: c,
	}
}

func (q *Querier[T]) All(ctx context.Context) ([]T, error) {
	// implementation
}

func (q *Querier[T]) Filter(ctx context.Context, filter ...Filter) ([]T, error) {
	// implementation
}
Later, your users can crete a new querier of any entity type and use
the existing client connection to query the database:
var client *database.Client // initiate

querier := database.NewQuerier[Person](client)
all, err := querier.All(ctx)
if err != nil {
    log.Fatal(err)
}

for _, person := range all {
    log.Println(person)
}
Facilitators make the limitation of having no generic methods disappear and
they add only a tiny bit of verbosity.There is nothing novel about this pattern but it needs a name for those who don’t know how to use parameterized receivers to achieve the same.
A playground is available in case you want to try it out.
Fri, Dec 3, 2021
Shard coordination has been one of the bigger challenges to design
sharded systems especially for engineers with little experience in the subject.
Companies like Facebook have been using general purpose shard coordinators,
e.g. Shard Manager, and suggesting that general
purpose sharding policies have been widely successful. A general
purpose sharding coordinator is not a solution to all advanced sharding needs,
but a starting point for average use cases.
It’s a framework to think about core abstractions
in sharded systems and providing a protocol that orchestrate sharding
decisions. In the last few weeks, I’ve been working on an extendible general purpose
shard coordinator, Shardz. In this article, I will explain
the main concepts and the future work.
Sharding
Sharding is a concept of sharding load to different nodes in a cluster
to horizontally scale systems. We can talk about two commonly used approaches
to sharding strategies.
Hashing
Hashing is used to map an arbitrary key to a node in a cluster. Keys and
hash functions are chosen carefully for load balancing to be effective.
With this approach, each incoming key is hashed and its modulo is
calculated to associate the key with one of the available nodes. Then,
the request is routed to that node to be served.
hash_function(key) % len(nodes)
This approach, even though its shortcomings, offer an easy to implement way
of designating a location to the incoming key. Consistent hashing can improve
the excessive migration of shards upon node failure or addition.
This approach is still commonly used in databases,
key/value caches, and web/RPC servers.
One of the significant shortcomings of hashing is that the destination node is determined
when handling an incoming request. The nodes in the system don’t know which
shards they are serving in advance unless they can calculate the key ranges they need to serve. This situation makes
it hard for nodes to preload data or it makes it harder to implement
strict replication policies. The other difficulty is that existing shards
cannot be easily visualized for debugging purposes unless you can query
where key ranges live.
Lookup tables
An alternative to hashing is to generate lookup tables. In this approach,
you keep track of available nodes and partitions you want to serve. Lookup
tables are regenerated each time a node or a partition is added or removed,
and is the source of the truth which node a partition should be served at.
Lookup tables can also help enforcing replication policies, e.g. ensure there
are at least two replicas being served at different nodes.
Lookup tables are generally easy to implement when you have homogenous nodes.
In heterogenous cases, node capacity can be used to
influence the distribution of partitions.
Shardz chose to only tackle the homogenous nodes for now but it’s trivial to
advance the coordinator to consider nodes with different capacity in the future.
P x N
Sharding with lookup tables is essentially a P x N problem where
you have P partitions and N nodes. The goal is to distribute P
partitions on the available nodes at any time. Most systems require
replication for fault tolerance, so we decided to identify a P with
a unique identifier and its replica number. At any times, a P should be
replicated on Ns based on how many replicas are required.
type P struct { ID string, Replica int }
type N struct { Host string }

We expect users to manage partitions separately and talk to the Shardz
coordinator to schedule them on the available nodes. The partitions
should be uniquely identified within the same coordinator.
Sharder
A core concept in Shardz is the Sharder interface. A sharder allows
users to register/unregister Ps and Ns. Then, users can query where
a partition is being served. Sharder interface can be implemented with
hashing or lookup tables. We don’t enforce any implementation details
but expect the following interface to be satisfied.
type Sharder interface {
	RegisterNodes(n ...N) error
	UnregisterNodes(n ...N) error
	RegisterPartitions(ids ...string) error
	UnregisterPartitions(ids ...string) error
	Partitions(n N) ([]P, error)
	Nodes(partitionID string) ([]N, error)
}
Sharders can be extended to satisfy custom needs such as implementing
custom replication policies, scheduling replicas in different availability
zones, finding the correct VM type/size to schedule the partition.
Work stealing replica sharder
Shardz comes with general use Sharder implementations. The default sharder
is a work stealing sharder that enforce a minimum number of replicas for
each partition. ReplicaSharder implements a trivial approach to find
the next available node by looking at the least overloaded node that
doesn’t already serve a replica of the partition. If this approach fails,
we will look for the first node that doesn’t already serve a replica of the partition.
If everything fails, we pick a random node and schedule the partition on it.
func nextNode(p P) {
    // Find the node with the lowest load.
    // If the node is not already serving p.ID, return the node.

    // Find all the available nodes.
    // Randomly loop for a while until you find a node
    // that doesn't serve p.ID (a replica).
    // Return the node if something is found in acceptable number of iterations.

    // Randomly pick a node and return.
}
Additional to the partition positioning, work stealing is triggered when
a new node joins or a partition is unregistered. Work stealing can be triggered
as many as times possible, e.g. routinely to avoid unbalanced load on nodes.
func stealWork() {
    // Calculate the average load on nodes.
    // Find nodes with 1.3x more load than average.

    // Calculate how many partitions need to be removed
    // from the overloaded node. Remove the partitions.

    // For each removed partition, call nextNode to find
    // a new node to serve the partition.
}
Protocol
Shardz have been heavily influenced by Shard Manager when it comes to making it easier for servers to report their status and coordinate with the manager.

A worker node creates a server that implements the protocol. ServeFn and
DeleteFn are the hooks when coordinator notifies the worker which partitions it should
serve or stop serving.
import "shardz"

server, err := shardz.NewServer(shardz.ServerConfig{
    Manager: "shardz.coordinator.local:7557", // shardz coordinator endpoint
    Node:    "worker-node1.local:9090",
    ServeFn: func(partition string) {
        // Do work to serve partition.
    },
    DeleteFn: func(partition string) {
        // Do work to stop serving partition.
    },
})
if err != nil {
    log.Fatal(err)
}

http.HandleFunc("/shardz", server.Handler)
log.Fatal(http.ListenAndServe(listen, nil))
At startup, worker node automatically pings the coordinator to register itself.
Then Shardz coordinator will ping the worker back periodically to check its status.
The partitions that need to be served by the worker is periodically distributed
and the ServeFn and DeleteFn functions are triggered automatically if
partitions changed.
At a graceful shutdown, worker node automatically reports that it’s going
away and give the coordinator a change to redistribute its partitions.
Fault tolerance
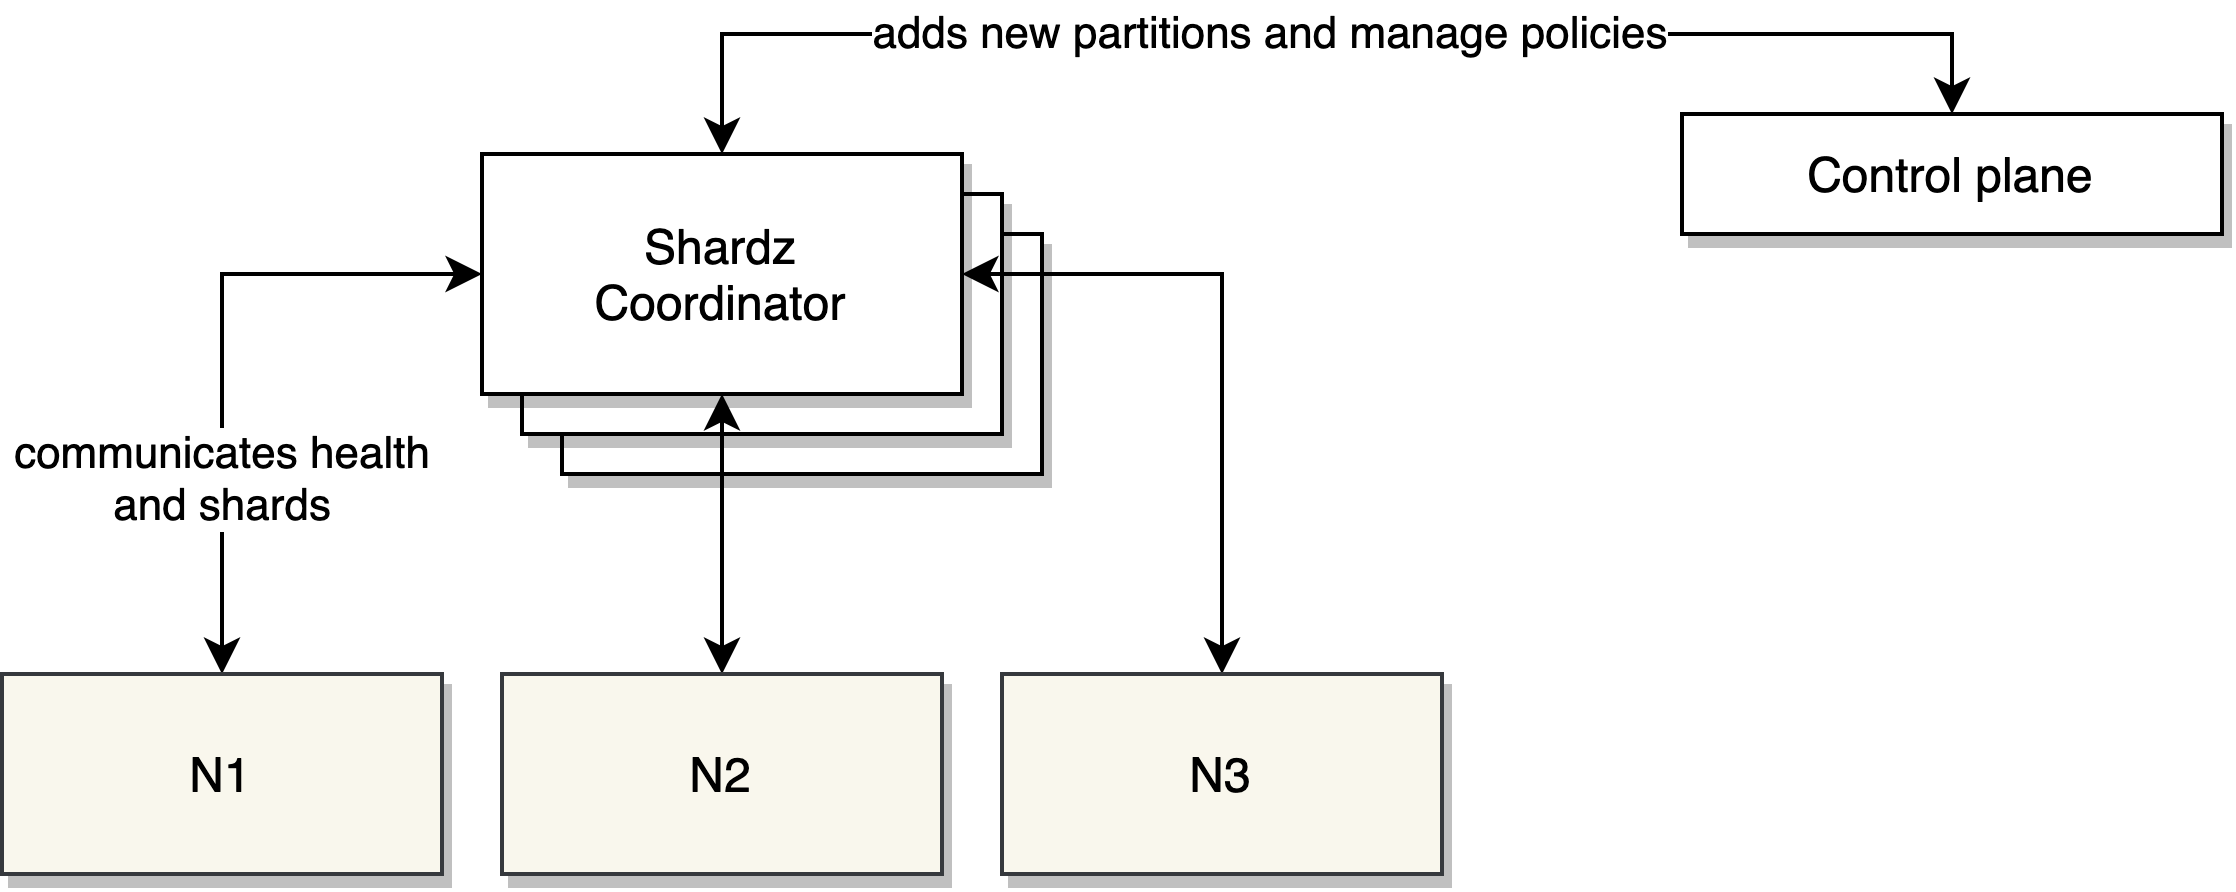
Shardz is designed to run in a clustered mode where there will
be multiple replicas of the coordinator at any time. The coordinator will have
a single leader that is responsible for sharding decision and propagating
them to others. If leader goes away, another replica becomes the leader.
ZooKeeper is used to coordinate the Shardz coordinators.
Future work
Shardz is still in the early stages but it’s a promising concept
to build a reusable multi purpose sharding coordinator. It has potential
to lower to entry barrier to design sharded systems. The next steps
for the project:
- Fault tolerance. The coordinator still has work to be finished when running
in the cluster mode.
- New Sharder implementations. Project aims to provide multiple
implementation with different policies to meet the needs. I desire to open
source this project to allow community to contribute.
- Language support for protocol implementation. We only have support
for Go and should expand the server implementation to capture more languages
to make it easy just to import a library to add Shardz support to any process.
- Visualization and management tools. Dashboards and custom control planes
to monitor, debug and manage shards.
- An ecosystem that speaks Shardz. It’s an ambitious goal but a unified
control plane for shard management would benefit the entire industry.
Wed, Jul 22, 2020
Spanner is a distributed database Google initiated a while ago to build a highly available and highly consistent database for its own workloads. Spanner was initially built to be a key/value and was in a completely different shape than it is today and it had different goals. Since the beginning, it had transactional capabilities, external consistency and was able to failover transparently. Over time, Spanner adopted a strongly typed schema and some other relational database features. In the last years, it added SQL support*. Today we are improving both the SQL dialect and the relational database features simultaneously. Sometimes there is confusion whether Spanner supports SQL or not. The short answer is yes. The long answer is this article.
Early years
Spanner was initially built for internal workloads and no one was able to see Google is going to initiate a cloud business and externalize Spanner. If you don’t know much about Google, our internal stack is often considered as a different universe. At Google, all systems including storage and database services provide their own proprietary APIs and clients. Are you planning to use your favorite ORM library when you join to Google? Unfortunately, it’s not possible. Our infrastructure services provide their own Stubby/gRPC APIs and client libraries. This is a minor disadvantage if you care about API familiarity but it’s a strong differentiator because we can provide more expressive APIs that represent the differentiated features of our infrastructure.
Differentiated features are often poorly represented in common APIs. One size doesn’t fit all. Common APIs can only target the common features. Distributed databases are already vastly different than traditional relational databases. I’ll give two examples in this article to show how explicit APIs make a difference.
Distributed systems fail differently and more often. In order to deal with this problem, distributed systems implement retrying mechanisms. Spanner clients transparently retries transactions when we fail to commit them. This allows us not to surface every temporary failure to the user. We transparently retry with the right backoff strategy.
In the following snippet, you see some Go code starting a new read-write transaction. It takes a function where you can query and manipulate data. When there is an abort or conflict, it retries the function automatically. ReadWriteTransaction documents this behavior and documents that the function should be safe to retry (e.g. telling the developers don’t hold application state). This allows us to communicate the unique reality of distributed databases to the user. We can also provide capabilities like auto-retries which are harder to implement in traditional ORMs.
import "cloud.google.com/go/spanner"

_, err := client.ReadWriteTransaction(ctx, func(ctx context.Context, txn *spanner.ReadWriteTransaction) error {
    // User code here.
})
Another example is the isolation levels. Spanner implements an isolation level better than the strictest isolation level (serializable) described in the SQL standard. Spanner doesn’t allow you to pick anything less strict for read/write transactions. But for multi-regional setups and read-only transactions, providing the strongest isolation is not always feasible. Our limits are tested by the speed of the light. For users who are ok with slightly stale data, Spanner has capabilities to provide stale reads. Stale reads allow users to read the version available in the regional replica. They can set how much staleness they can tolerate. For example, the transaction below can tolerate up to 10 seconds.
import "cloud.google.com/go/spanner"
client.ReadOnlyTransaction().
    WithTimestampBound(spanner.MaxStaleness(10*time.Second)).
    Query(ctx, query)
Staleness API allows us to explicitly express how snapshot isolation works and how Spanner can go and fetch the latest data if replica is very out of date. It also allows us to highlight how multi-regional replication is a hard problem and even with a database like Spanner, you may consider compromising from consistency for better latency characteristics in a multi-regional setup.
F1
F1 was the original experiment for the first steps towards having SQL support in Spanner. F1 is a distributed database at Google that is built on top of Spanner. Unlike Spanner, it supported:
- Distributed SQL queries
- Transactionally consistent secondary indexes
- Change history and stream
It implemented these features in a coordination layer on top of Spanner and handed off everything else to Spanner.
F1 was built to support our Ads products. Given the nature of the ads business and the complexity of our Ads products, being able to write and run complex queries was critical. F1 made Spanner more accessible to business-logic heavy systems.
Spanner in Cloud
Fast forward, Google Cloud launched Spanner for our external customers. When it was first released, it only had SQL support to query data. It lacked INSERT, UPDATE and DELETE statements.
Given it didn’t fully a SQL database back then, it also lacked driver support for JDBC, database/sql and similar. Driver support became a possibility when Cloud Spanner implemented a Data Manipulation Language (DML) support for inserts, updates and deletes.
Today, Cloud Spanner supports both DDLs (for schema) and DMLs (for data). Cloud Spanner uses a SQL dialect used by Google. ZetaSQL, a native parser and analyzer of this dialect has open sourced a while ago. As of today, Cloud Spanner also provides a query analysis tool.

Next?
There are current challenges originated from the differences present in our SQL dialect. This is an area we are actively trying to improve. Not just we don’t want our users to deal with a new SQL flavor, the current situation is also slowing down our work on ORM integrations. Some of the ORM frameworks hardcode SQL when generating queries and giving drivers little flexibility to override behavior. In order to avoid any inconsistencies, we are trying to close the differences with popular dialects.
Dialect differences are not the only problem affecting our SQL support. One other significant gap is the lack of some of the common traditional database features. Spanner never supported features like default values or autogenerated IDs. As we are improving the dialect differences, it’s always in our radar to simultaneously address these significant gaps.
(*) The initial work on Spanner’s querying work is published as Spanner: Becoming a SQL System.
Wed, Jun 17, 2020
Update: The proposal draft has been
revisited to use brackets
instead of parenthesis. This article will be updated with
the new syntax soon.
Ian Lance Taylor and Robert Griesemer have been working on a
generics proposal
for Go for a while.
Unlike other proposals, a highly significant language
change as such generics will require experimentation and comprehensive
feedback before it can be finalized and submitted as
a formal language change proposal.
As an initial step, they have been working on an transitioning tool
so the Go users can put their ideas into test and have working
understanding of the proposal. go2go is a tool available if you
install Go from the source.
Then you can build, run and test .go2 files with generics.
$ go tool go2go
go2go <command> [arguments]

The commands are:

	build      translate and build packages
	run        translate and run list of files
	test       translate and test packages
	translate  translate .go2 files into .go files
Alternatively, they are providing the same capability from the
go2go playground, so the Go developers
can easily test their ideas without having to install Go from source.
I highly recommend you to take a look at the playground to begin.
When I was going through a draft of the proposal to put some of my
ideas into test, there were many gotchas moments I had. In this
article, I’ll share some of them to help you with your own experimentation
efforts. This article is a living document and might be updated as I discover more.
Please read
the proposal
first, the current version
of the proposal contains most of the answers.
If you have similar questions, report them to provide feedback.
Readability of this feature will be significantly important and your
feedback is very critical given generics
make languages more complicated to read.
What can be generic?
Functions can be generic, similar to the Print function below.
At the call site, Print can be called against any type
that will determine what T is.
func Print(type T)(s []T) {
	for _, v := range s {
		fmt.Print(v)
	}
}

Print(int)([]int{1, 2, 3}) // will print 123
Structs can also rely on generic types.
A list that uses a generic item
type can be defined as:
type List(type T) struct {
	list []T
}
When constructing a new List, users provide the item type. This is
how you can use the same List implementation
against different item types. In the example below we are creating
a list of integers:
list := List(int){}
Interfaces can represent cases where methods need to use
generic types. For example, a database
iterator interface is provided below. Implementors of this interface
will provide generic mechanisms that will iterate over
a user-specified type:
type Iterator(type T) interface {
	Next() (T, error)
}
Currently, methods cannot have their own generic signatures.
The Do function below is accepting a generic type, C as its arguments.
The code will not compile. If you have cases where being able
to provide generic methods
type List(type T) struct {
	list []T
}

func (l *List(T)) Do(type C)(c []C) {}
prog.go2:20:26: methods cannot have type parameters
Can receivers accept generic types?
Yes. If you have a generic concrete type, its recievers
can accept generic types and refer to the generic type
in their arguments. Below, the generic List can use any
user provided type as its item type. Users will be able
to call Add with the objects of type T – a type they
provided to construct List(T).
type List(type T) struct {
	list []T
}

func (l *List(T)) Add(item T) {}
How to constraint a generic type?
Generic types can be of a particular interface or the empty interface.
func Print(type T)(s []T) {} // accepts every type
func Print(type T io.Writer)(s []T) {} // accepts types if T implements io.Writer
How to allocate a generic slice?
Defining, initializing or allocating generic slices are not different
than any regular slice. All the operations on T below are valid operations:
func Do(type T)(s []T) {
	var t []T
	t = make([]T, 10)
	t = append(t, s...)
}
Can you compose generic interfaces?
Yes. Interface composition is working as expected.
If you want to provide a specialized
version of the Iterator(type T), you can defer to composition.
type Iterator(type T) interface {
	Next() (T, error)
}

type IteratorCloser(type T) interface {
	(Iterator(T))
	Close() error
}
How to call a generic functions generically?
Calling generic functions from a generic function is pretty
straightforward. You can pass the generic type identifier, T,
to another function.
func Print(type T)(s []T) {
	for _, v := range s {
		PrintOne(T)(v)
	}
}

func PrintOne(type T)(s T) {
	fmt.Print(s)
}
At first, this confused me because argument identifiers in
Go are lower case. So, I didn’t see the T is another identifier
until I’m told so. The upside of having T in upper case is
it allows me to differentiate the generic type list from
the argument list. I hope the upper case becomes the convention.
Are type assertions possible?
Yes, but this confused me initially. If you tried to type cast
directly on the generic variable such as below, you will get an
error saying r is not an interface type, even though r implements
io.Reader.
func Do(type T io.Reader)(r T) {
	switch r.(type) {
	case io.ReadCloser:
		fmt.Println("ReadCloser")
	}
}
prog.go2:19:9: r (variable of type T) is not an interface type
But when you explicitly cast r to an interface before casting:
func Do(type T io.Reader)(r T) {
	switch (interface{})(r).(type) {
	case io.ReadCloser:
		fmt.Println("ReadCloser")
	}
}
Tue, May 19, 2020
Spanner is a relational database with 99.999% availability which is roughly 5 mins a year. Spanner is a distributed system and can span multiple machines, multiple datacenters (and even geographical regions when configured). It splits the records automatically among its replicas and provides automatic failover. Unlike traditional failover models, Spanner doesn’t failover to a secondary cluster but can elect an available read-write replica as the new leader.
In relational databases, providing both high availability and high consistency in writes is a very hard problem. Spanner’s synchronous replication, the use of dedicated networking and Paxos voting provides high availability without compromising consistency.
High availability of reads vs writes
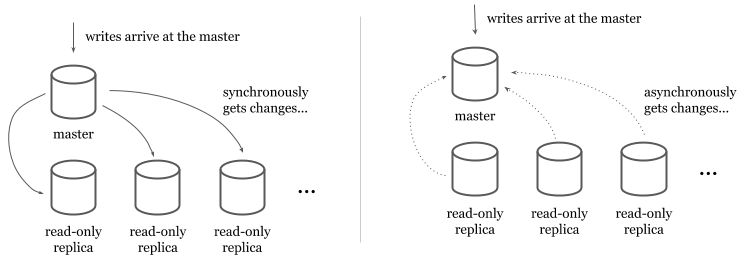
In traditional relational databases (e.g. MySQL or PostgreSQL), scaling and providing higher availability to reads is easier than writes. Read-only replicas provide a copy of the data read-only transactions can retrieve from. Data is replicated to the read-only replicas from a read-write master either synchronously or asynchronously.
In synchronous models, master synchronously writes to the read replicas at each write. Even though this model ensures that read-only replicas always have the latest data, it makes the writes quite expensive (and causes availability issues for writes) because the master has to write to all available replicas before it returns.
In asynchronous models, read-only replicas get the data from a stream or a replication log. Asynchronous models make writes faster but introduce a lag between the master and the read-only replicas.
Users have to tolerate the lag and should be monitoring it to identify replication outages. The asynchronous writes make the system inconsistent because not all the replicas will have the latest version of the until asynchronous synchronization is complete. The synchronous writes make data consistent by ensuring all replicas got the change before a write succeeds.

Horizontally scaling reads by adding more read replicas is only part of the problem.
Scaling writes is a harder problem. Having more than one master is introducing additional problems. If a master is having outage, other(s) can keep serving writes without users experiencing downtime. This model requires replication of writes among masters. Similar to read replication, multi-master replication can be implemented asynchronously or synchronously. If implemented synchronously, it often means less availability of writes because a write should replicate in all masters and they should be all available before it can succeed. As a tradeoff, multi-master replication is often implemented with asynchronous replication but it negatively impacts the overall system by introducing:
- Looser consistency characteristics that violate ACID promises.
- Increased risk of timeouts and communication latency.
- Necessity for conflict resolution between two or more masters if conflicting updates happened but not communicated.
Due to the complexity and the failure modes multi-master replication introduces, it’s not a commonly preferred way of providing high availability in practice.
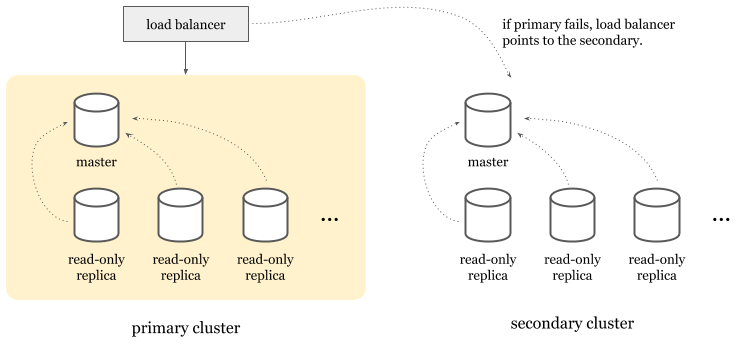
As an alternative, high-availability clusters are a more popular choice. In this model, you’d have an entire cluster that can take over when the primary master goes down. Today, cloud providers implement this model to provide high availability features for their managed traditional relational database products.

Topology
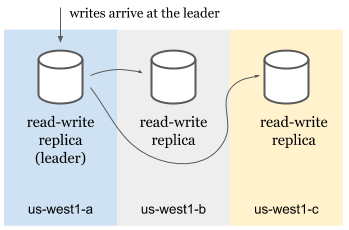
Spanner doesn’t use high availability clusters but approaches to the problem from a different angle. A Spanner cluster* contains multiple read-write, may contain some read-only and some witness replicas.
- Read-write replicas serve reads and writes.
- Read-only replicas serve reads.
- Witnesses don’t serve data but participate in leader election.
Read-only and witness replicas are only used for multi-regional Spanner clusters that can span across multiple geographical regions. Single region clusters only use read-write replicas. Each replica lives in a different zone in the region to avoid single point of failure due to zonal outages.

Splits
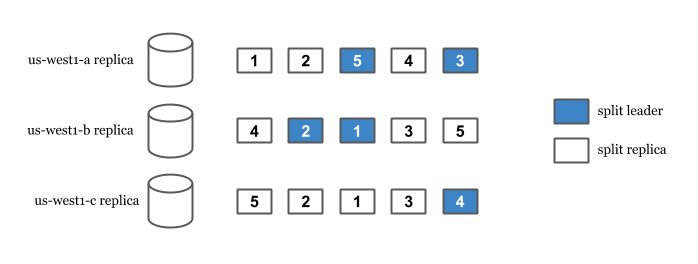
Spanner’s replication and sharding capabilities come from its splits. Spanner splits data to replicate and distribute them among the replicas. Split happens automatically when Spanner detects high read or high write load among the records. Each split is replicated and has a leader replica.
When a write arrives, Spanner finds the split the row is in. Then, we look for the leader of that split and route the write to the leader. This is true even in multi-region setups where user is geographically closer to another non-leader read-write replica. In the case of an outage of the leader, an available read-write replica is elected as the leader and user’s write is served from there.

In order for a write to succeed, a leader needs to synchronously replicate the change to the other replicas. But isn’t this impacting the availability of the writes negatively? If writes need to wait for all replicas to succeed, a replica can be a single point of failure because writes wouldn’t succeed until all replicas replicate the change.
This is where Spanner does something better. Spanner only requires a majority of the Paxos voters to successfully write. This allows writes to succeed even when a read-write replica goes down. Only the majority of the voters are required not all of the read-write replicas.
Synchronous replication
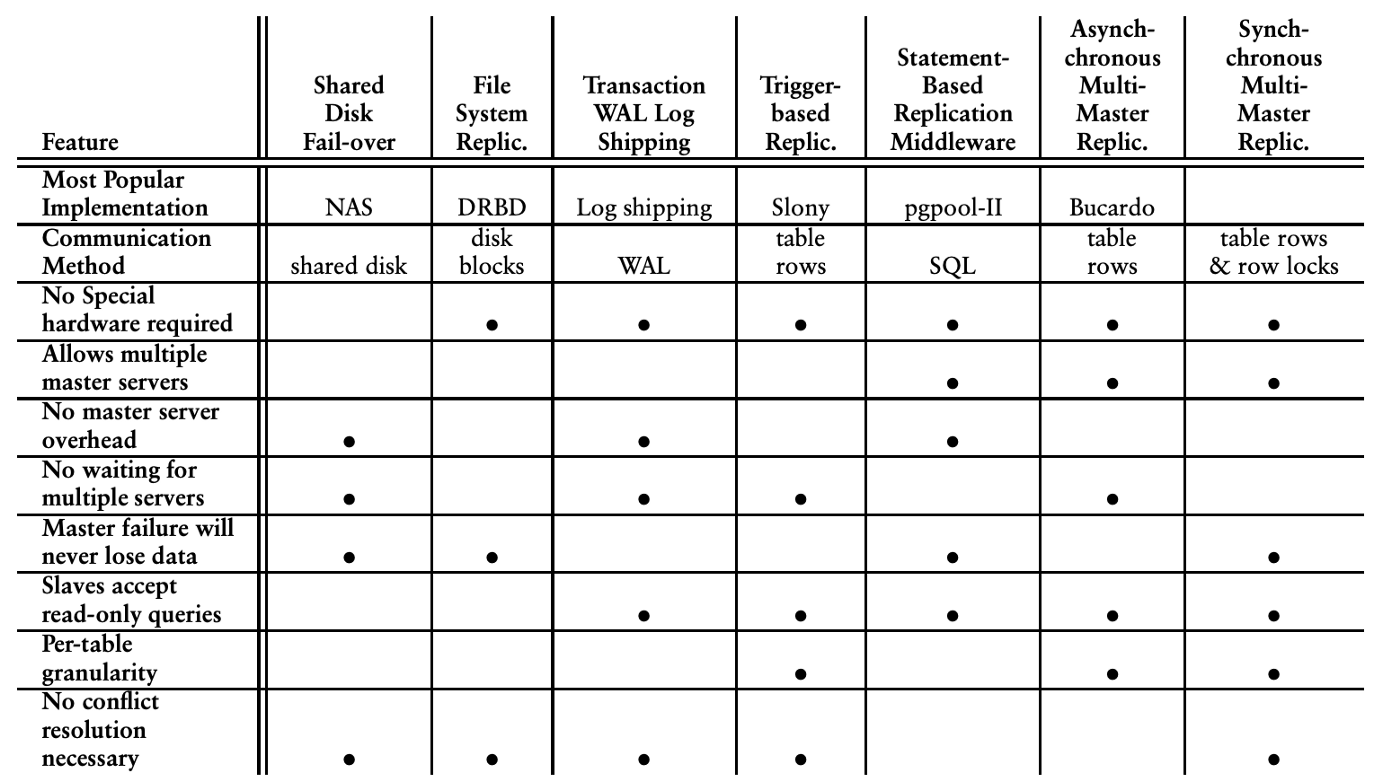
As mentioned above, synchronous replication is hard and impacts the availability of the writes negatively. On the other hand when replication happens asynchronously, they cause inconsistencies, conflicts and sometimes data loss. For example, when a master becomes unavailable due to a networking issue, it may still have committed changes but might have not delivered them to the secondary master. If the secondary master updates the same records after a failover, data loss can happen or conflict resolution may be required. PostgreSQL provides a variety of replication models with different tradeoffs. The tradeoffs summary below can give you a very high level idea of how many different concerns to worry about when designing replication models.
A summary of various PostgreSQL replication models and their tradeoffs:

Spanner’s replication is synchronous. Leaders have to synchronously communicate with other read/write replicas about the change and confirm it in order for a write to succeed.
Two-phase commit (2PC)
While writes only affecting a single split uses a simpler and faster protocol, if two or more splits are required for a write transaction, two-phase commit (2PC) is executed. 2PC is infamously known as “the anti-availability protocol” because it requires participation from all the replicas and any replica can be a single point of failure. Spanner still serves writes even if some of the replicas are unavailable, because only a majority of voting replicas are required in order to commit a write.
Network
Spanner is a distributed system and is inherently affected by problems that are impacting distributed systems in general. Networking itself is a factor of outages in distributed systems. On the other hand, Google cites only 7.6% of the Spanner failures were networking related. Spanner’s 99.999% availability is not highly affected from networking outages. This is mostly because it runs on Google’s private network. Years of operational maturity, reserved resources, having control over upgrades and hardware makes networking not a significant source of outages. Eric Brewer’s earlier article explains the role of networking in this case more in detail.
Colossus
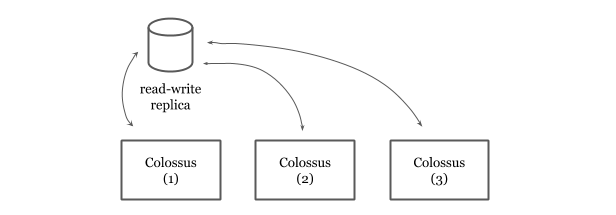
Spanner’s durability guarantees come from Google’s distributed file system, Colossus. Spanner also mitigates some more risk by depending on Colossus. The use of Colossus allows us to have the file storage decoupled from the database service. Spanner is a “shared nothing” architecture and because any server in a cluster can read from Colossus, replicas can recover quickly from whole-machine failures.
Colossus also provides replication and encryption. If a Colossus instance goes down, Spanner can still work on the data via the available Colossus instances. Colossus encrypts data and this is why Spanner provides encryption at rest by default out of the box.

Spanner read-write replicas hands off the data to Colossus where data is replicated for 3 times. Given there are three read-write replicas in a Spanner cluster, this means the data is replicated for 9 times.
Automatic Retries
As repeatedly mentioned above, Spanner is a distributed system and is not magic. It experiences more internal aborts and timeouts than traditional databases when writing. A common strategy in distributed systems in order to deal with partial and temporary failures is to retry. Spanner client libraries provide automatic retries for read/write transactions. In the following Go snippet, you see the APIs to create a read-write transaction. The client automatically retries the body if it fails due to aborts or conflicts:
import "cloud.google.com/go/spanner"
_, err := client.ReadWriteTransaction(ctx, func(ctx context.Context, txn *spanner.ReadWriteTransaction) error {
    // User code here.
})
One of the challenges of developing ORM framework support for Google Cloud Spanner was the fact most ORMs didn’t have automatic retries, therefore their APIs didn’t give developers a sense that they shouldn’t maintain any application state in the scope of a transaction. In contrast, Spanner libraries care a lot of retries and make an effort to automatically deliver them without creating extra burden to the user.
Spanner approaches to sharding and replication differently than traditional relational databases. It utilizes Google’s infrastructure and fine-tunes several traditionally hard problems to provide high availability without compromising consistency.
- (*) Google Cloud Spanner’s terminology for a cluster is an instance. I avoided to use “instance” because it is an overloaded term and might mean “replica” for the majority of the readers of this article.
- (**) The write is routed to the split leader. Read the Splits section for more.
Thu, Feb 6, 2020
Go has been continuously growing in the past decade, especially
among the infrastructure teams and in the cloud ecosystem.
In this article, we will go through some of the unique strengths
of Go in this field.
We will also cover some gotchas that may not be obvious to the users
at the first sight.
Build small binaries. Go builds small binaries. This makes it a good
language to build artifacts for containerized or serverless environments.
The final artifact with runtime dependencies can be as small as 20-25 MBs.
Runtime initialization is fast. Go’s runtime initialization is fast.
If you are writing autoscaling servers in Go, cold start can’t
be affected by Go’s runtime initialization. Go libraries and frameworks
are also trying to be on the side of fast initialization compared to
some other ecosystem such as JVM languages. The entire
ecosystem contributes to fast process start.
Build static binaries. Go programs compile into a static binary. This allows users
to simplify their final delivery process in most cases. Go binaries can be used
as a final artifact of the CI/CD systems and deployed by copying the binary
to a remote machine.
Cross compile to 64-bit Linux. Go compiler provides cross compilation. Especially
if you don’t have any CGO dependencies, you can easily cross compile to
any operating system and architecture. This allows users to build for their
production environment regardless of their build environment.
For example, regardless of your current environment,
running the following command builds for Linux 64-bit:
$ GOOS=linux GOARCH=amd64 go build
Don’t ship your toolchain. In your production environment, you don’t need
Go toolchain to run Go. The final artifact is a small executable binary. You don’t
have to care about installing and maintaining Go across your servers. Also, don’t
ship containers with Go toolchain. Instead use the toolchain to build
and copy the final binary into the production container.
Rebuild and redeploy with Go releases. Go only supports the last two major
versions. Just because Go runtime is compiled in the body,
with each Go release, rebuild and redeploy your production services.
At Google, we use the release candidates to build production services as soon as
there is an RC version. You can use the RC version for production services, or at
least push to canary with the RC version. If you see an unexpected behavior,
immediately file an issue.
The go tool can print the Go version used to build a binary:
$ go version <binary>
<binary>: go1.13.5
You can additionally use tools like gops
to list and report the Go versions of the binaries currently running on your system.
Embed commit versions into binaries. Embed the revision numbers
when you are building a Go binary.
You can also embed the build constraint and other
options used when building.
debug.BuildInfo
also provides information about the module as well as the dependencies.
Alternatively, go command can report module information and the dependencies:
$ go version -m dlv
dlv: go1.13.5
	path	github.com/go-delve/delve/cmd/dlv
	mod	github.com/go-delve/delve	v1.3.2	h1:K8VjV+Q2YnBYlPq0ctjrvc9h7h03wXszlszzfGW5Tog=
	dep	github.com/cosiner/argv	v0.0.0-20170225145430-13bacc38a0a5	h1:rIXlvz2IWiupMFlC45cZCXZFvKX/ExBcSLrDy2G0Lp8=
	dep	github.com/mattn/go-isatty	v0.0.3	h1:ns/ykhmWi7G9O+8a448SecJU3nSMBXJfqQkl0upE1jI=
	dep	github.com/peterh/liner	v0.0.0-20170317030525-88609521dc4b	h1:8uaXtUkxiy+T/zdLWuxa/PG4so0TPZDZfafFNNSaptE=
	dep	github.com/sirupsen/logrus	v0.0.0-20180523074243-ea8897e79973	h1:3AJZYTzw3gm3TNTt30x0CCKD7GOn2sdd50Hn35fQkGY=
	dep	github.com/spf13/cobra	v0.0.0-20170417170307-b6cb39589372	h1:eRfW1vRS4th8IX2iQeyqQ8cOUNOySvAYJ0IUvTXGoYA=
	dep	github.com/spf13/pflag	v0.0.0-20170417173400-9e4c21054fa1	h1:7bozMfSdo41n2NOc0GsVTTVUiA+Ncaj6pXNpm4UHKys=
	dep	go.starlark.net	v0.0.0-20190702223751-32f345186213	h1:lkYv5AKwvvduv5XWP6szk/bvvgO6aDeUujhZQXIFTes=
	dep	golang.org/x/arch	v0.0.0-20171004143515-077ac972c2e4	h1:TP7YcWHbnFq4v8/3wM2JwgM0SRRtsYJ7Z6Oj0arz2bs=
	dep	golang.org/x/crypto	v0.0.0-20180614174826-fd5f17ee7299	h1:zxP+xTjjk4kD+M5IFPweL7/4851FUhYkzbDqbzkN1JE=
	dep	golang.org/x/sys	v0.0.0-20190626221950-04f50cda93cb	h1:fgwFCsaw9buMuxNd6+DQfAuSFqbNiQZpcgJQAgJsK6k=
	dep	gopkg.in/yaml.v2	v2.2.1	h1:mUhvW9EsL+naU5Q3cakzfE91YhliOondGd6ZrsDBHQE=
FaaS is Go binary as a service. Function-as-a-service products such as
Google Cloud Functions or AWS Lambda serves Go functions. But in fact, they are
building a user function into a binary and serve the binary. This means you
have to organize and build packages acknowledging this fact. Because the final
binary is not forked for every incoming request but is being reused:
- You may have data races if you access to common resources from multiple functions.
- You may need to use
sync.Once in the function to initialize some
of the resources if you need the incoming request to initialize.
- Background goroutines may need to keep working even after the function is finished and
binary is about to be terminated. You may need to flush data manually or gradually
shutdown background routines.
- Providers are not consistent about signaling the Go process before a shutdown.
Expect hard terminations as soon as your function exits.
- You may want to use the incoming request’s context for calls initiated in
the function. In such cases, being able to reuse resources are getting harder.
Gracefully reject incoming requests. When auto scaling down or shutting down new
resources, start rejecting incoming requests to the Go program. http.Server provides
Shutdown for this purpose.
Report the essential metrics. Go runtime and diagnostics tools provide a variety
of essential metrics from the Go programs. Report them to your monitoring systems.
Some of these metrics can be accessible by
runtime.NumGoroutine, runtime.NumThreads, runtime.NumCGOCalls and
runtime.ReadMemStats.
See instrumentation libraries such as Prometheus’ Go library
as a reference on what can be exported.
Print scheduling and GC events. Go can optionally print out scheduling
and GC related events to the standard output. When in production,
you can use the GODEBUG
environmental variable to print out verbose insights from the runtime.
The following command will start the binary and print GC events
as well as the state of the current utilization at every 5000 ms
to the standard out:
$ GODEBUG=gctrace=1,schedtrace=5000 <binary>
Propagate the incoming context. Go allows propagating the context in the process
via context.Context.
You can also signal cancellation or timeout decisions
to other goroutines using context. You can use context to propagate values
such as trace/request IDs or other metadata relevant in the critical path.
You can log with context key/values where it applies.
If you have an incoming request context, keep propagating it.
For example:
http.HandleFunc("/", func(w http.ResponseWriter, r *http.Request) {
    // use r.Context() for the calls made here.
})
Continuously profile in production. Go uses pprof which is
a lightweight profiling collection mechanism. It only adds a single-digit
percentage overhead to the execution when enabled. You can utilize this
strength by collection profiles from production systems and understanding
the fleet-wide hotspots to optimize. See
Continuous Profiling of Go programs for more insights
and a reference implementation of a continuous profiling product.
pprof can symbolize the profiling
data by incorporating the binary. If you are collecting
profiles from production, you’d like to store profiling data with symbols.
Even though there is no good standard library function for this task,
there is an existing reference that
can be adopted.
Dump debuggable postmortems. Go allows post-mortem debugging. When running
Go in production, core dumps allow you to retrospectively investigate why binaries
crash. If you have Go programs constantly crashing, you can retrieve their core
dumps and understand why the crashed and which state they were in. You can
also utilize core dumps to debug in production by taking a snapshot (a core dump)
and using your debugger. See core dumps for more.
Mon, Jan 20, 2020
Go’s defer keyword allows us to schedule a function to run
before a function returns. Multiple functions
can be deferred from a function. defer is often used
to cleanup resources, finish function-scoped tasks, and
similar.
Deferring functions are great for maintability.
By deferring, for example, we reduce the risk
of forgetting to close the file
in the rest of the program:
func main() {
    f, err := os.Open("hello.txt")
    if err != nil {
        log.Fatal(err)
    }
    defer f.Close()

    // The rest of the program...
}
Deferring helps us by delaying the execution of the Close method
while allowing us to type it when we have the right context.
This is how deferred functions also help the readability
of the source code.
How defer works
Defer handles multiple functions by stacking them hence running
them in LIFO order. The more deferred functions you have,
the larger the stack will be.
func main() {
	for i := 0; i < 5; i++ {
		defer fmt.Printf("%v ", i)
	}
}
The above program will output “4 3 2 1 0 ” because the last
deferred function will be the first one to be executed.
When a function is deferred, the variables accessed by it
are stored as its arguments. For each deferred function,
compiler generates a runtime.deferproc call at the call site and
call into runtime.deferreturn at the return point of the function.
0: func run() {
1:    defer foo()
2:    defer bar()
3:
4:    fmt.Println("hello")
5: }
The compiler will generate code similar to below for the program above:
runtime.deferproc(foo) // generated for line 1
runtime.deferproc(bar) // generated for line 2

// Other code...

runtime.deferreturn() // generated for line 5
Defer used to require two expensive runtime calls
explained above. This made deferring functions
to be significantly more expensive than non-deferred functions.
For example, consider to lock and unlock a sync.Mutex
deferred and not-deferred.
var mu sync.Mutex
mu.Lock()

defer mu.Unlock()
The program above will work 1.7x slower than the non-deferred
version. Even though it only takes ~25-30 nanoseconds to lock and
unlock a mutex by deferring, it makes a difference in large
scale use or in cases where a function call need to be completed
under 10 nanoseconds.
BenchmarkMutexNotDeferred-8   	125341258	         9.55 ns/op	       0 B/op	       0 allocs/op
BenchmarkMutexDeferred-8      	45980846	        26.6 ns/op	       0 B/op	       0 allocs/op
This overhead is why Go developers started to avoid
defers in certain cases to improve performance.
Unfortunately this situation make Go developers
compromise readability.
Inlining deferred functions
In the last few versions of Go, there have been gradual improvements
to defer’s performance. But with Go 1.14, some common cases
will see a highly significant performance improvement. The compiler
will generate code to inline some of the
deferred functions at return points. With this improvement,
calling into some deferred functions will be only as expensive as
making a regular function call.
0: func run() {
1:    defer foo()
2:    defer bar()
3:
4:    fmt.Println("hello")
5: }
With the new improvements, above code will generate:
// Other code...

bar() // generated for line 5
foo() // generated for line 5
It is possible to do this improvement only in static cases. For example,
in a loop where the execution is determined by the input size dynamically,
the compiler doesn’t have the chance to generate code to inline all
the deferred functions. But in simple cases
(e.g. deferring at the top of the function or in conditional blocks
if they are not in loops), it is
possible to inline the deferred functions. With 1.14, easy cases will be
inlined and runtime coordination will be only required if the compiler
cannot generate code.
I already tried the Go 1.14beta with
the mutex locking/unlocking example above. Deferred and non-deferred
versions perform very similarly now:
BenchmarkMutexNotDeferred-8   	123710856	         9.64 ns/op	       0 B/op	       0 allocs/op
BenchmarkMutexDeferred-8      	104815354	        11.5 ns/op	       0 B/op	       0 allocs/op
Go 1.14 is a good time to reevaluate deferring if you avoided defers
for performance gain.
If you are looking for more about this improvement, see the
Low-cost defers through inline code proposal and
GoTime’s recent episode on defer with
Dan Scales.
Disclaimer: This article is not peer-reviewed but thanks to Dan Scales
for answering my questions while I was investigating this improvement.
Mon, Nov 18, 2019
Non-uniform memory access (NUMA) is an approach to optimize memory access time
in multi-processor architectures. In NUMA architectures, processors can access
to the memory chips near them instead of going to the physically distant ones.
In the distant past CPUs generally ran slower than the memory.
Today, CPUs are quite faster than the memory they use. This became a problem
because processors constantly started to wait for data to be retrieved from the
memory. As a result of such data starvation problems, for example,
CPU caches became a popular addition to modern computer architecture.
With multi processors architectures, the data starvation problem became worse.
Only one processor can access the memory at a time. With multiple processors trying
to access to the same memory chip resulted in further wait times for the processors.
NUMA is an architectural design and a set of capabilities trying to address problems
such as:
- Data-intensive situations where processors are starving for data.
- Multi-processor architectures where processors non-optimally race for memory access.
- Architectures with large number of processors where physical distance to memory is a problem.
Nodes
NUMA architectures consist of an array of processors closely located to a memory.
Processors can also access the remote memory but the access is slower.
In NUMA, processors are grouped together with local memory. These groups
are called NUMA nodes. Almost all modern processors also contains a non-shared memory
structure, CPU caches. Access to the caches are the fastest, but shared memory is
required if data needs to be shared. In shared cases, access to the local memory
is the fastest.
Processors also have access to remote memory.
The difference is that accessing remote memory is slower
because the interconnect is slower.

NUMA architectures provide APIs for the users to set fine-tuned affinities. The
main way how this works is to allocate memory for a thread on its local node.
Then, make the thread running in the same node. This will allow the optimal
data access latency for memory.
Linux users might be familiar with sched_setaffinity(2) which allows its users to
lock a thread on a specific processor. Think about NUMA APIs as a way to
lock a thread to a specific set of processors and memory. Even if the thread is preempted,
it will only start rerunning on a specific node where data locality is optimal.
NUMA in Linux
Linux has NUMA support for a while. NUMA supports provides
tools, syscalls and libraries.
numactl allows to set affinities and gather information about
your existing system. To gather information about the NUMA nodes,
run:
$ numactl --hardware
You can set affinities of a process you are launching. The following
will set the CPU node affinity of the launching process
to node 0 and will only allocate from 0.
$ numactl --cpubind=0 --membind=0 <cmd>
You can allocate memory preferable on the given node. It will still
allocate memory in other nodes if memory can’t be allocated on the
preferred node:
$ numactl --preferred=0 <cmd>
You can launch a new process to allocate always from the local memory:
$ numactl --localalloc <cmd>
You can selectively only execute on the given CPUs. In the following case,
the new process will be executed either on processor 0, 1, 2, 5 or 6:
$ numactl --physcpubind=0-2,5-6 <cmd>
See numactl(8) for the full list of capabilities.
Linux kernel supports NUMA architectures by providing some syscalls. From user programs,
you can also call the syscalls. Alternatively, numa
library provides an API for the same capabilities.
Optimizations
Your programs may need NUMA:
- If it’s clear from the nature of the problem that memory/processor affinity is needed.
- If you have been analyzing CPU migration patterns and locking a thread to a node can improve the performance.
Some of the following tools could be useful diagnosing the need for optimizations.
numastat(8) displays some
hits or misses per node. You can see if memory is allocated as intended on the
prefered nodes. You can also see how often memory is allocated on local vs remote.
numatop allows you to inspect the local vs remote
memory access stats of the running processes.
You can see the distance between nodes via numactl --hardware to avoid allocating from distant nodes.
This will allow you to optimize to avoid the overhead of the interconnect.
If you need to further analyze thread scheduling and migration patterns, tracing tools such as
Schedviz might be useful to visualize kernel scheduling decisions.
One more thing…
Recently, on the Go Time podcast, I briefly mentioned how I’m directly calling into
libnuma from Go programs for NUMA affinity. I think, everyone was thinking
I was joking. In Go, runtime scheduler doesn’t allow you to have precise
control or doesn’t expose the underlying processor/architecture. If you are running
highly CPU intensive goroutines with strict memory access requirements, NUMA bindings
might be an option.
One thing you need to make sure is to lock the OS thread, so the goroutine is kept
being scheduled to run on the same OS thread which can set its affinity via NUMA APIs.
DON’T TRY THIS HOME (unless you know what you are doing):
import "github.com/rakyll/go-numa"

func main() {
	if !numa.IsAvailable() {
		log.Fatalln("NUMA is not available on this machine.")
	}

	// Make sure the underlying OS thread
	// doesn't change because NUMA can only
	// lock the OS thread to a specific node.
	runtime.LockOSThread()

	// Runs the current goroutine always in node 0.
	numa.SetPreferred(0)
    // Allocates from the node's local memory.
    numa.SetLocalAlloc()

	// Do work in this goroutine...
}
Please don’t use this if you are 100% sure what you are doing. Otherwise,
it will limit the Go scheduler and your programs will
see a significant performance penalty.
Wed, Dec 27, 2017
It is real struggle to work with a new language,
especially if the type doesn’t resemble what you have previously
seen. I have been there with Go and lost my
interest in the language when it first came out due to the
reason I was pretending it is something I already knew.
Go is considered as an object-oriented language even though it lacks type hierarchy.
It has an unconventional type system. It is expected
to do the things differently in this language given the traditional paradigms are not always going to help the Go users.
This article contains a few gotchas.
Program flow first, types later
In Go, program flow
and behavior are not tightly coupled to the abstractions. You don’t start programming by thinking about the types but rather the flow/behavior. As you need to represent your data
in more sophisticated ways, you start introducing your types.
More recently Rob Pike shared his thoughts on the separation
of data and behavior:
… the more important idea is the separation of concept:
data and behavior are two distinct concepts in Go, not
conflated into a single notion of “class”.
– Rob Pike
Go has a strong emphasis on the data model. Structs (which are
aggregate types) provide a light-weight way to represent data.
The lack of type hierarchy helps structs to keep being thin,
structs never represent the layers and layers of inherited
behavior but only the data fields. This makes them closer to the
data structures they represent rather than the behavior
they are additionally providing.
Embedding is not inheritance
Code reuse is not provided by type hierarchy but via composition.
Language ecosystems with classical
inheritance is often suffering from excessive level of indirection
and premature abstractions based on inheritance which later makes the code complicated and unmaintainable.
Instead of providing type hierarchy, Go allows composition
and dispatching of the methods via interfaces. The language
allows embedding and most people
assume the language has some limited
support for sub-classing types – this is not true.
Embedding is really not very different than having a regular field
but allows you to embed the methods on the embedded type directly
into the new type.
Consider the following struct:
type File struct {
    sync.Mutex
    rw io.ReadWriter
}
Then, File objects will directly have access to sync.Mutex methods:
f := File{}
f.Lock()
It is no different than providing Lock and Unlock methods from File
and make them operate on a sync.Mutex field. This is not sub-classing.
Polymorphism
Due to lack of sub-classing, polymorphism in Go is achieved
only with interfaces. Methods are dispatched during runtime
depending on the concrete type.
var r io.Reader

r = bytes.NewBufferString("hello")

buf := make([]byte, 2048)
if _, err := r.Read(buf); err != nil {
    log.Fatal(err)
}
Above, r.Read will be dispatched to (*Buffer).Read.
Please note that embedding is not sub-classing,
embedding types can not be assigned to what they
are embedding. The following code is not
going to compile:
type Animal struct {}

type Dog struct {
	Animal
}


func main() {
	var a Animal
	a = Dog{}
}
No explicit interface implementations
Go doesn’t have an implements that explicitly allowing you to
tell you are implementing an interface. It assumes you are implementing an interface if the method signature matches the
one in the interface definition.
How does this scale? Is it possible to accidentally implement
interfaces you didn’t mean to implement? Although mechanically
possibly, it has never been an issue for our user base to pass
an implementation of one interface mistakenly for another one.
Interfaces often are widely different, or
it is sign there might not be a need of a second interface
if two interfaces are quite similar.
We have a culture of not introducing new interfaces but prefer
to use the ones provided by the standard library or use the established ones from the community.
This culture also reduces the number of similar
looking interfaces.
No header files or no culture of “let’s introduce interfaces first”.
If you don’t want to provide multiple implementations of the same
high-level behavior, you don’t introduce interfaces.
Naming patterns based on other languages'
dependency inversion conventions are anti-patterns in Go.
Naming styles such the following don’t fit
into the Go ecosystem.
type Banana interface {
    //...
}
type BananaImpl struct {}
One more thing…
Go prefer small interfaces.
You can always embed interfaces later but
you cannot decompose large ones.
No constructors
Go doesn’t have constructors hence doesn’t allow you
to override the default constructor. Default
construction always result in zero-valued fields.
Go has a philosophy to use zero-value to represent the
default. Utilize zero-value as much as possible to provide
the default behavior.
Some structs may require more work such as validation,opening a
connection, etc before becoming useful to the user. In such cases,
we prefer initialization functions.
func NewRequest(method, url string, body io.Reader) (*Request, error)
NewRequest validates method and url, sets up the right internals
to read from the given body and returns a request.
Nil receivers
Nil is a value, nil value of a type can implement behavior.
Developers don’t have to provide concrete types for
noop implementations.
If you are introducing an interface, only to provide a noop
implementation of your concrete type, don’t do it.
Below, event logging will be a noop for the nil values.
type Event struct {}

func (e *Event) Log(msg string) {
    if e == nil {
        return
    }
    // Log the msg on the event...
}
Then user can use the nil value for the noop behavior:
var e *Event
e.Log("this is a message")
No generics
Go doesn’t have generics.
There are ongoing conversations happening on what kind of generics
would be a good fit for Go. Given the unique type system, it is not
easy to just copy an existing approach and assume it will be
useful for the majority and will be
orthogonal to the existing language features.
Go Experience Reports are waiting for user input to see what kind of use cases could have
helped the Go users if Go had generics.
Tue, Oct 10, 2017
pprof now is coming with a Web UI. In order to try it out,
go get the pprof tool:
$ go get github.com/google/pprof
The tool launches a web UI if -http flag is provided. For example,
in order to launch the UI with an existing profile data, run the
following command:
$ pprof -http=:8080 profile.out
You can focus, ignore, hide, and show with regexp. As well as clicking
on the boxes and using the refining menu also works:
You can peek, list, and disassemble and box. Especially listing is
a frequently used feature to understand the cost by line:
You can also have the regular listing view and use regexp filtering
to focus, ignore, hide and show.
Recently, web UI added support for flame graphs. The pprof tool is now able to display flame
graphs without any external dependencies!
The Web UI is going to be in Go 1.10, but you can try it by go getting
from head and report bugs and improvements!
Tue, Jul 18, 2017
Note: This article contains non-finalized ideas; we may end up not implementing any of this but ideally we should do work towards the direction explained here.
Go is the language to write servers, Go is the language to write microservices. Yet, we haven’t done much in the past for latency analysis and observability/diagnostics of request/RPC performance.
GopherCon 2017 was an opportunity for me to discuss our roadmap for latency analysis. I have talked to many whose main job is to provide instrumentation solutions to the ecosystem.
A few common problems have been pointed out by pretty much everyone I talked to:
- Instrumentation requires manual labor. Go code cannot be auto-instrumented by intercepting calls.
- Lack of a standard library package; third party packages cannot provide out-of-the-box instrumentation without external dependencies.
- Dropped traces; libraries don’t know how to propagate traces to the outside world. We need a
context.Context key to propagate traces and be able to discover the current trace by looking into the incoming context.
- Lack of standard library support; e.g. packages like
database/sql can be instrumented to create spans for each ExecContext if the given context has already has a trace ID.
- Lack of diagnostics data available from runtime per trace ID. It would be ideal to be able to record runtime events (e.g. scheduling events) with trace IDs and then pull them to further investigate low-level runtime events happened in the lifetime of a request.
Apart from the Go-specific issues, we often came back to the problem of the wild fragmentation in the tracing community and how the lack of the compatibility among tracing backends damage the possibility of establishing more in the library space.
There is not much we can do beyond the boundaries of Go other than advocating for a requirement to fix fragmentation which I already personally do.
Instrumentation
We are currently not interested to solve (1) in a fashion other languages do by providing primitives that can intercept every call. Initially there is a lot to be done by creating a common instrumentation library and putting manual spans in place. A common instrumentation layer also solves the problems explained at (2) and (3).
To address these items, we will propose a package with a trace context representation, FromContext/NewContext to propagate trace context via context.Context, and a small API to create/end/annotate spans.
Users will be able to start and stop trace collection in a Go program dynamically; and export collected trace data.
Users will need to write transformation code if they would like to follow an existing distributed trace (e.g. an existing Zipkin trace propagated via an incoming HTTP request’s header).
Once we establish a package, we can revise the standard library packages to see where we can inject out-of-the-box instrumentation. Some existing ideas:
database/sql: A span can be created for each ExecContext and finished when exec is completed to measure latency.os/exec: A span can be created for CommandContext to measure command exec latency.net/http: http.Transport can create spans for outgoing requests.
The next steps for net/http is to be able to propagate traces via http.Request. Ideally we want http.Transport to inject the right trace context header to the outgoing requests and http.Handlers to extract trace contexts into req.Context. The wild fragmentation in the tracing backends don’t help us much here. Each backend requires a different encoding/decoding to serialize/deserialize trace contexts and different HTTP headers to put them in place. There is an ongoing effort to unify things in this area and we will wait for it rather than trying to meet the backend-specific requirements.
There is also an experimental work to annotate runtime events recorded by the execution tracer with trace IDs, which will address the basic requirements of (5). If you need to collect more precise data on what else is happening in the lifetime of a trace, you will be optionally record runtime events and attach them to the current trace.
Visualization
Nothing has been planned so far to visualize the per-node data. We expect the exported data can be transformed into the data format of the user’s existing distributed tracing backend and visualized there. For those who are looking for a local env setup, I suggest Zipkin given it is very easy to run it locally as a standalone service. I am in also favor of maintaining high-quality transformation drivers for Zipkin or OpenTracing somewhere outside of the standard lib.
Conclusion
We have clearer idea what we want to achieve in the scope of Go for latency profiling. The next steps are converting these ideas into proposals and discuss them with the broader Go community, give feedback to the tracing community for the standardization efforts, and create awareness of these concepts and tools.
Sun, Jul 16, 2017
Go scheduler’s job is to distribute runnable goroutines over
multiple worker OS threads that runs on one or more processors.
In multi-threaded computation, two paradigms have emerged in scheduling: work sharing and work stealing.
- Work-sharing: When a processor generates new threads, it attempts to migrate some of them to the other processors with the hopes of them being utilized by the idle/underutilized processors.
- Work-stealing: An underutilized processor actively looks for other processor’s threads and “steal” some.
The migration of threads occurs less frequently with work stealing
than with work sharing. When all processors have work to run, no threads are being migrated. And as soon as there is an idle processor, migration is considered.
Go has a work-stealing scheduler since 1.1, contributed by Dmitry Vyukov. This article will go in depth explaining what work-stealing schedulers are and how Go implements one.
Scheduling basics
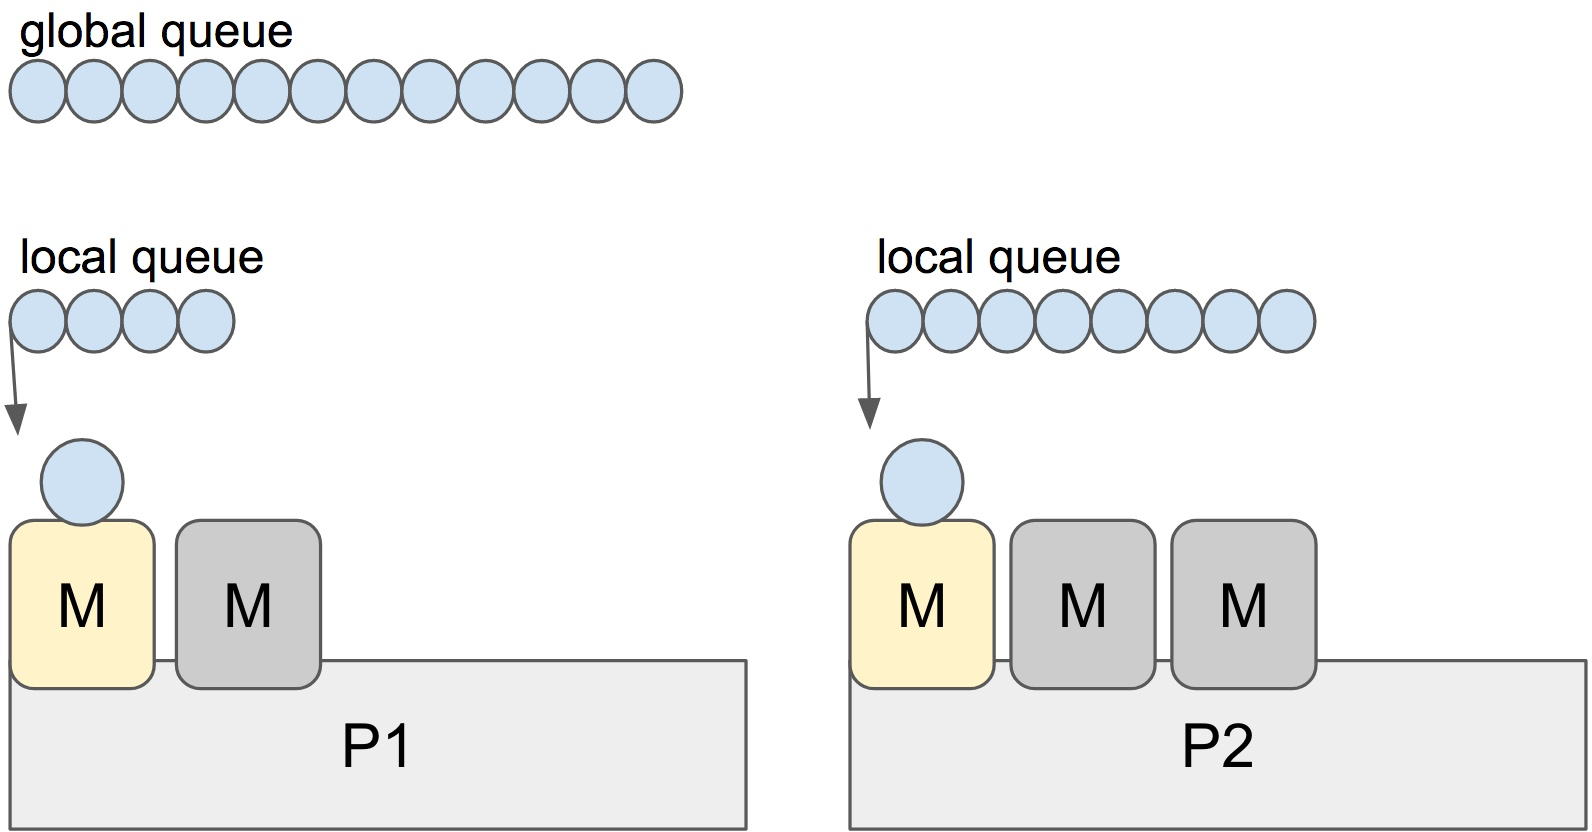
Go has an M:N scheduler that can also utilize multiple processors. At
any time, M goroutines need to be scheduled on N OS threads that runs on at most GOMAXPROCS numbers of processors.
Go scheduler uses the following terminology for goroutines, threads and processors:
- G: goroutine
- M: OS thread (machine)
- P: processor
There is a P-specific local and a global goroutine queue.
Each M should be assigned to a P. Ps may have no Ms if they are blocked or in a system call.
At any time, there are at most GOMAXPROCS number of P. At any time, only one M can run per P.
More Ms can be created by the scheduler if required.

Each round of scheduling is simply finding a runnable goroutine and executing it.
At each round of scheduling, the search happens in the following order:
runtime.schedule() {
    // only 1/61 of the time, check the global runnable queue for a G.
    // if not found, check the local queue.
    // if not found,
    //     try to steal from other Ps.
    //     if not, check the global runnable queue.
    //     if not found, poll network.
}
Once a runnable G is found, it is executed until it is blocked.
Note: It looks like the global queue has an advantage over the local queue
but checking global queue once a while is crucial to avoid M is only scheduling
from the local queue until there are no locally queued goroutines left.
Stealing
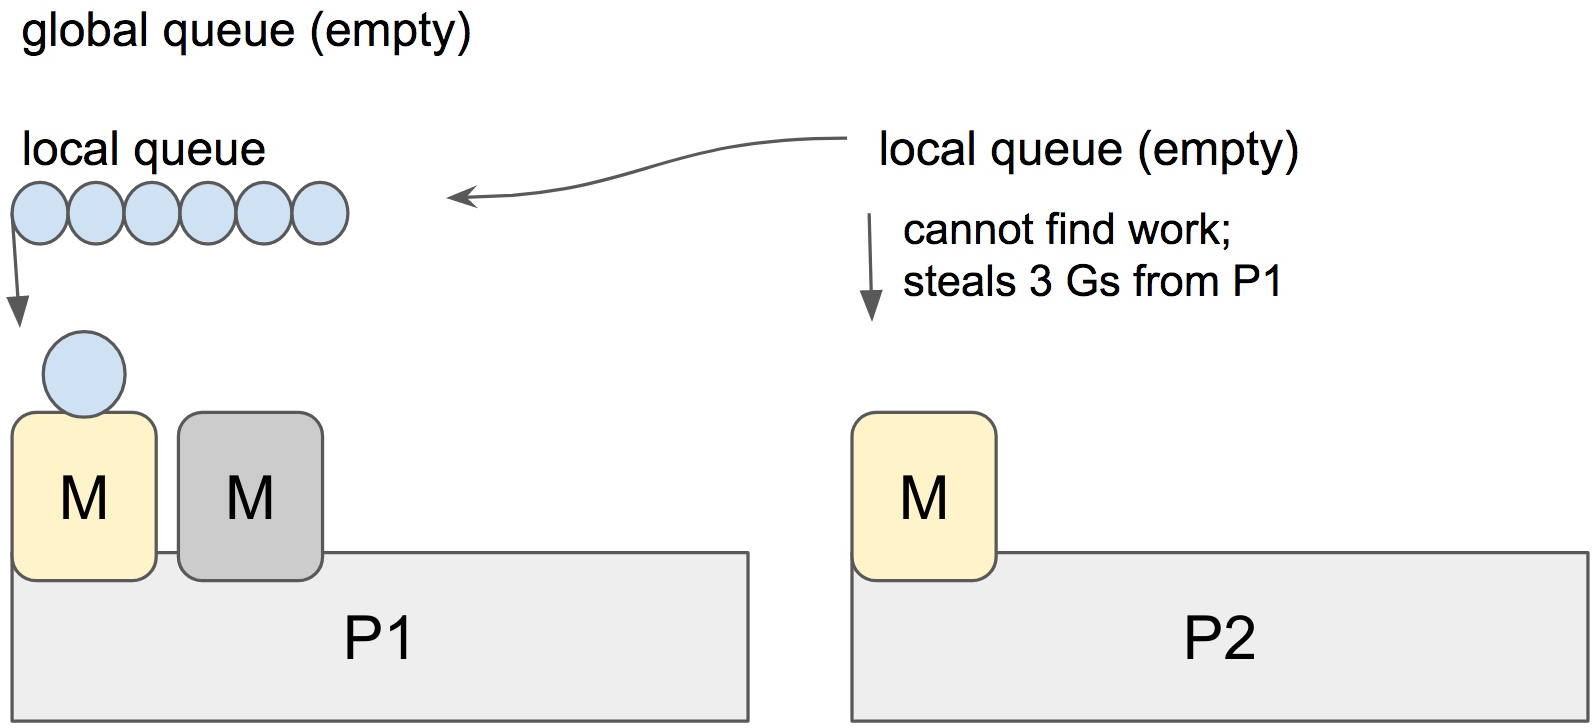
When a new G is created or an existing G becomes runnable, it is pushed onto a list of runnable goroutines of current P. When P finishes executing G, it tries to pop a G from own list of runnable goroutines. If the list is now empty, P chooses a random other processor (P) and tries to steal a half of runnable goroutines from its queue.

In the case above, P2 cannot find any runnable goroutines. Therefore, it randomly picks another processor (P1) and steal three goroutines to its own local queue. P2 will be able to run these goroutines and scheduler work will be more fairly distributed between multiple processors.
Spinning threads
The scheduler always wants to distribute as much as runnable goroutines to Ms to utilize the processors but at the
same time we need to park excessive work to conserve CPU and power. Contradictory to this, scheduler should also need to be able to scale to high-throughput and CPU intense programs.
Constant preemption is both expensive and is a problem for high-throughput programs if the performance is critical. OS threads shouldn’t frequently hand-off runnable goroutines between each other, because it leads to increased latency. Additional to that in the presence of syscalls, OS threads need to be constantly blocked and unblocked. This is costly and adds a lot of overhead.
In order to minimize the hand-off, Go scheduler implements “spinning threads”. Spinning threads consume a little extra CPU power but they minimize the preemption of the OS threads.
A thread is spinning if:
- An M with a P assignment is looking for a runnable goroutine.
- An M without a P assignment is looking for available Ps.
- Scheduler also unparks an additional thread and spins it when it is readying a goroutine if there is an idle P and there are no other spinning threads.
There are at most GOMAXPROCS spinning Ms at any time. When a spinning thread finds work, it takes itself out of spinning state.
Idle threads with a P assignment don’t block if there are idle Ms without a P assignment. When new goroutines are created or an M is being blocked, scheduler ensures that there is at least one spinning M. This ensures that there are no runnable goroutines that can be otherwise running; and avoids excessive M blocking/unblocking.
Conclusion
Go scheduler does a lot to avoid excessive preemption of OS threads by scheduling them to the right and underutilized processors by stealing, as well as implementing “spinning” threads to avoid high occurrence of blocked/unblocked transitions.
Scheduling events can be traced by the execution tracer. You can investigate what’s going on if you happen to believe you have poor processor utilization.
References
Mon, Jul 3, 2017
Go 1.9 is introducing profiler labels, a way to add arbitrary key-values to the samples collected by the CPU profiler. CPU profilers collect and output hot spots where the CPU spent most time in when executing. A typical CPU profiler output is primarily reports the location of these spots as function name, source file/line, etc. By looking at the data, you can also examine which parts of the code invoked these spots. You can also filter by invokers to have more granular understanding of certain execution paths.
Even though locality information is useful to spot expensive execution paths, it is not always essentially enough when debugging a performance problem. A significant percentage of Go programmers uses Go to write servers, and it is even more complex to point out performance issues in a server. It is hard to isolate certain execution paths from others, or hard to understand whether it is only a certain path creating trouble (e.g. a user or a specific handler).
With 1.9, Go is introducing a new feature that allows you to record additional information to provide more context about the execution path. You will be able to record any set of labels, as a part of the profiling data. Then, use these labels to examine the profiler output more precisely.
You can benefit from profiler labels in many cases. Some of the obvious ones:
- You don’t want to leak your software abstractions into the examination of the profiling data; e.g. a profiling dashboard of a web server will be useful if it displays handler URL paths, rather than function names from the Go code.
- Execution stack location is not enough to understand the originator of work; e.g. a consumer that reads from a message queue does work originated somewhere else, the consumer can set labels to identify the originator.
- Context-bound information is required to debug profiling problems.
Adding labels
The runtime/pprof package will export several new APIs to let users add labels. Most users will use Do which takes a context, extends it with labels, records these labels when f is executing:
func Do(ctx context.Context, labels LabelSet, f func(context.Context))
Do only set the given label set during the execution of the current goroutine. If you want to start goroutines in f, you can propagate the labels by passing the context argument of the function.
labels := pprof.Labels("worker", "purge")
pprof.Do(ctx, labels, func(ctx context.Context) {
    // Do some work...

    go update(ctx) // propagates labels in ctx.
})
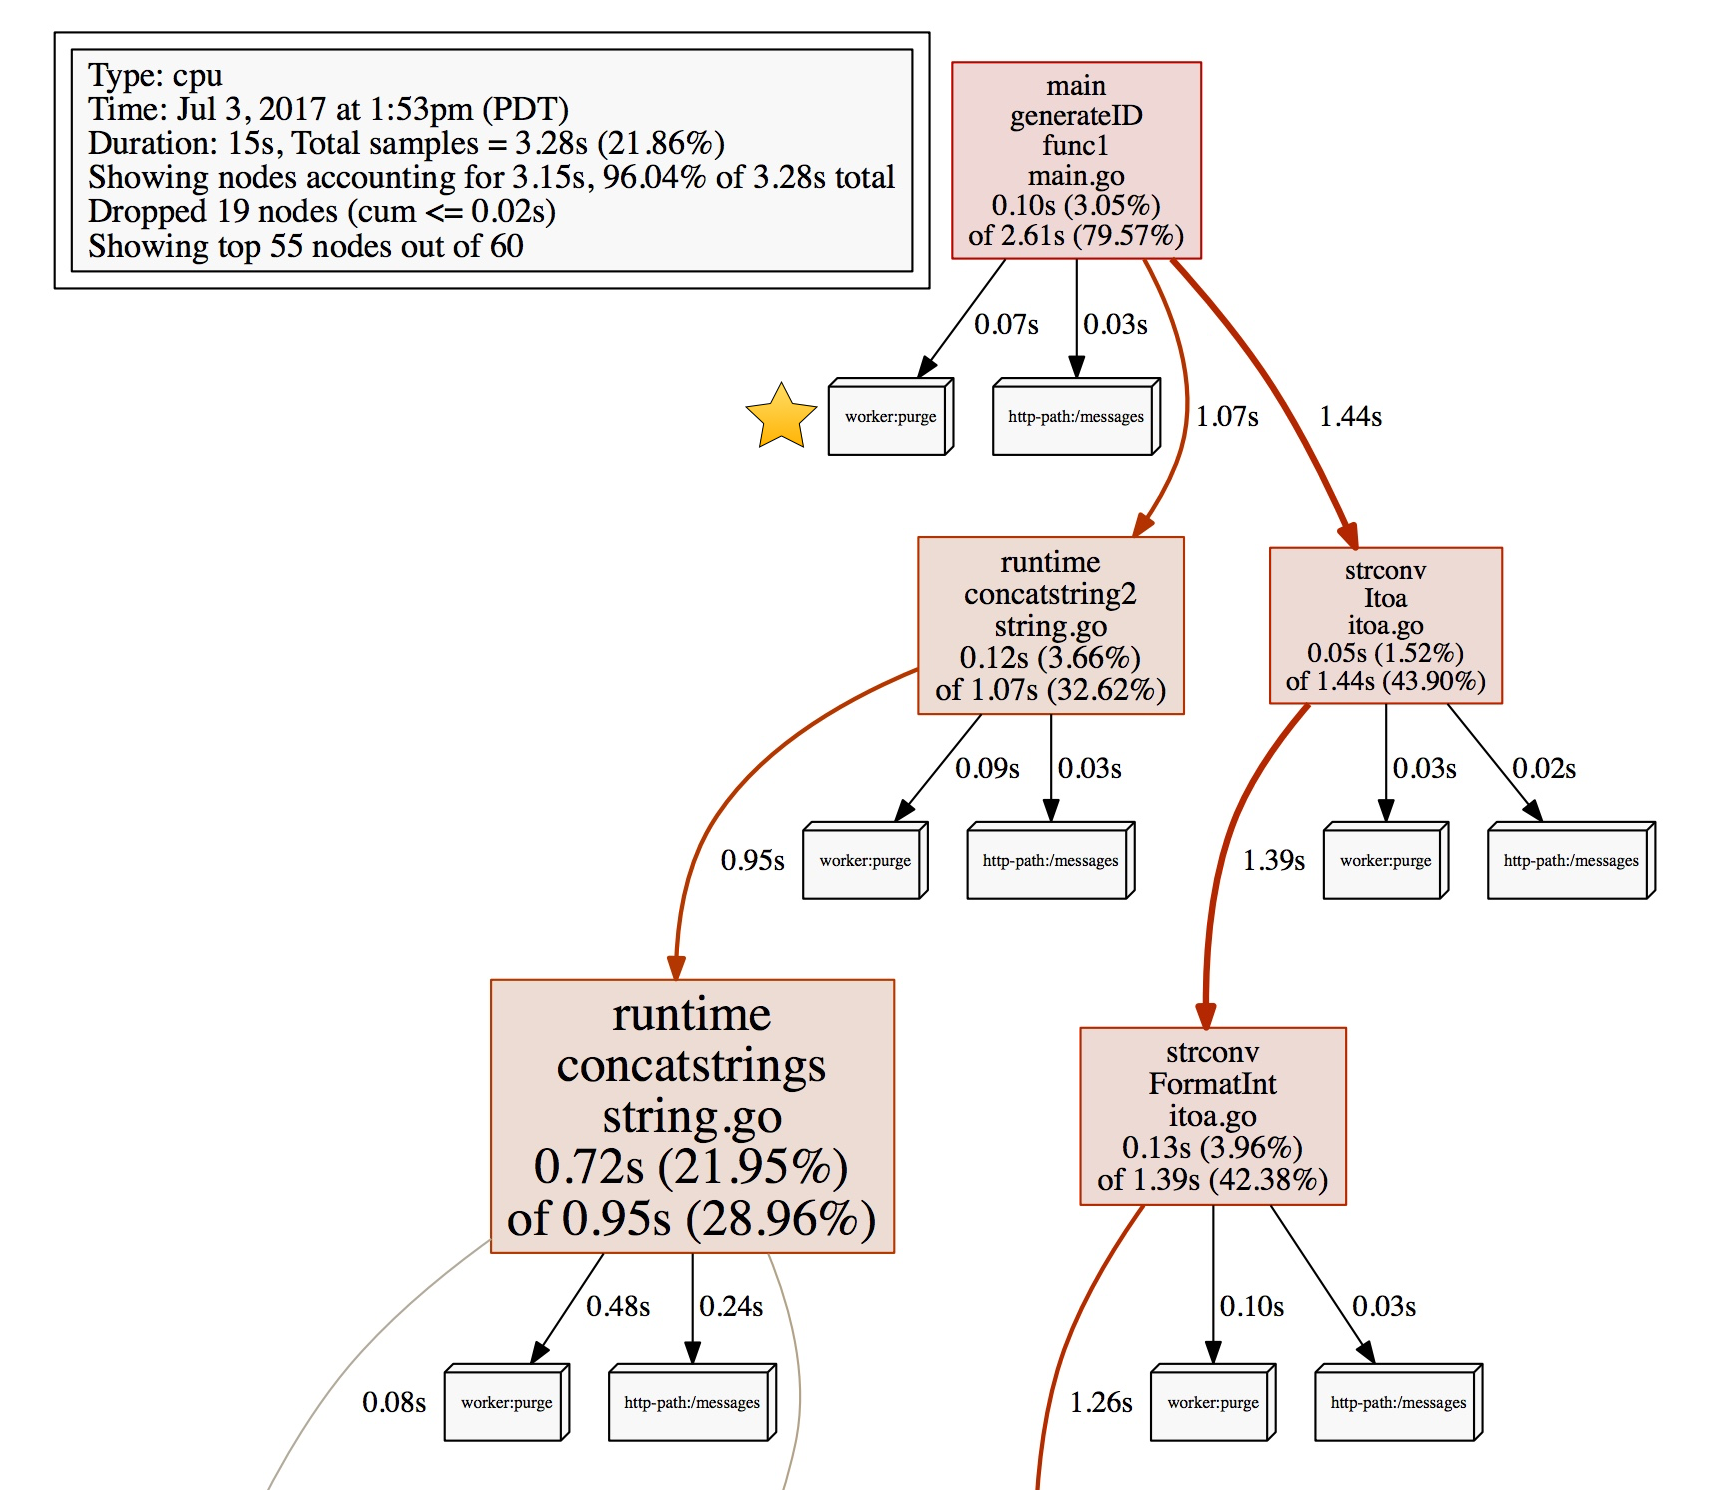
The work above will be labeled with worker:purge.
Examining the profiler output
This section will demonstrate how to examine the recorded samples by profiler labels. Once you annotate your code with labels, it is time to profile and consume the profiler data with tag filters.
I will use the net/http/pprof package to capture samples in this demo, see the Profiling Go programs article for more options.
package main

import _ "net/http/pprof"

func main() {
    // All the other code...
    log.Fatal(http.ListenAndServe("localhost:5555", nil))
}
Collect some CPU samples from the server.
$ go tool pprof http://localhost:5555/debug/pprof/profile
Once the interactive mode starts, you can list the recorded labels by the tags command. Note that pprof tools call them tags even though they are named labels in the Go standard library.
(pprof) tags
http-path: Total 80
        70 (87.50%): /messages
        10 (12.50%): /user

worker: Total 158
       158 (  100%): purge
As you can see, there are two label keys (http-path, worker) and several values recorded for each. http-path key is coming from HTTP handlers I annotated, and worker:purge is originated at the code above.
By filtering by labels, we can focus only on the samples collected from the /user handler.
(pprof) tagfocus="http-path:/user"
(pprof) top10 -cum
Showing nodes accounting for 0.10s, 3.05% of 3.28s total
      flat  flat%   sum%        cum   cum%
         0     0%     0%      0.10s  3.05%  main.generateID.func1 /Users/jbd/src/hello/main.go
     0.01s   0.3%   0.3%      0.08s  2.44%  runtime.concatstring2 /Users/jbd/go/src/runtime/string.go
     0.06s  1.83%  2.13%      0.07s  2.13%  runtime.concatstrings /Users/jbd/go/src/runtime/string.go
     0.01s   0.3%  2.44%      0.02s  0.61%  runtime.mallocgc /Users/jbd/go/src/runtime/malloc.go
         0     0%  2.44%      0.02s  0.61%  runtime.slicebytetostring /Users/jbd/go/src/runtime/string.go
         0     0%  2.44%      0.02s  0.61%  strconv.FormatInt /Users/jbd/go/src/strconv/itoa.go
         0     0%  2.44%      0.02s  0.61%  strconv.Itoa /Users/jbd/go/src/strconv/itoa.go
         0     0%  2.44%      0.02s  0.61%  strconv.formatBits /Users/jbd/go/src/strconv/itoa.go
     0.01s   0.3%  2.74%      0.01s   0.3%  runtime.memmove /Users/jbd/go/src/runtime/memmove_amd64.s
     0.01s   0.3%  3.05%      0.01s   0.3%  runtime.nextFreeFast /Users/jbd/go/src/runtime/malloc.go
The listing contains only samples labeled with http-path:/user. So we can easily understand the most expensive execution paths from the user handler.
You can also use tagshow, taghide, and tagignore commands as other filtering options. For example, tagignore allows you to match anything but the given regex.
The filter below will match anything but the user handler; worker:purge and http-path:/messages in this case.
(pprof) tagfocus=
(pprof) tagignore="http-path:/user"
(pprof) tags
http-path: Total 70
        70 (  100%): /messages

worker: Total 158
       158 (  100%): purge
If you visualize the filtered samples, the output will show how much each label is contributing to the final cost.

You can see that worker:purge used 0.07s, and messages handler used 0.03s in the generateID function during the collection of the profiling data.
Try it yourself!
Profiler labels allows us to add additional information to the profiler data that is not available at the current execution stack. Try them by downloading the Go 1.9 beta if you need more dimensions in your profiler output. Also, try the pprofutil package to automatically add HTTP path label to your handlers.
Fri, Jun 30, 2017
Go provides several pprof profiles out of thet box to gather
profiling data from Go programs.
The builtin profiles provided by the runtime/pprof package:
- profile: CPU profile determines where a program spends its time while actively consuming CPU cycles (as opposed while sleeping or waiting for I/O).
- heap: Heap profile reports the currently live allocations; used to monitor current memory usage or check for memory leaks.
- threadcreate: Thread creation profile reports the sections of the program that lead the creation of new OS threads.
- goroutine: Goroutine profile report the stack traces of all current goroutines.
- block: Block profile show where goroutines block waiting on synchronization primitives (including timer channels). Block profile is not enabled by default; use runtime.SetBlockProfileRate to enable it.
- mutex: Mutex profile reports the lock contentions. When you think your CPU is not fully utilized due to a mutex contention, use this profile. Mutex profile is not enabled by default, see runtime.SetMutexProfileFraction to enable.
Additional to the builtin profiles, runtime/pprof package allows you to export your custom profiles, and instrument your code to record
execution stacks that contributes to this profile.
Imagine we have a blob server, and we are writing a Go client for it. And our users want to be able to profile the opened blobs on the client. We can create a profile and record the events of blob opening and closing, so the user can tell how many open blobs they are at any time.
Here is a blobstore package that allows you to open some blobs. We will create a new custom profile and start
recording execution stacks that contributes to opening of blobs:
package blobstore

import "runtime/pprof"

var openBlobProfile = pprof.NewProfile("blobstore.Open")

// Open opens a blob, all opened blobs need
// to be closed when no longer in use.
func Open(name string) (*Blob, error) {
	blob := &Blob{name: name}
	// TODO: Initialize the blob...

	openBlobProfile.Add(blob, 2) // add the current execution stack to the profile
	return blob, nil
}
And once users want to close the blob, we need to remove the execution stack associated with the current blob from the profile:
// Close closes the blob and frees the
// underlying resources.
func (b *Blob) Close() error {
	// TODO: Free other resources.
	openBlobProfile.Remove(b)
	return nil
}
And now, from the programs using this package, we should be able to retrieve blobstore.Open profile data and use our daily pprof tools to examine and visualize them.
Let’s write a small main program than opens some blobs:
package main

import (
	"fmt"
	"math/rand"
	"net/http"
	_ "net/http/pprof" // as a side effect, registers the pprof endpoints.
	"time"

	"myproject.org/blobstore"
)

func main() {
	for i := 0; i < 1000; i++ {
		name := fmt.Sprintf("task-blob-%d", i)
		go func() {
			b, err := blobstore.Open(name)
			if err != nil {
				// TODO: Handle error.
			}
			defer b.Close()

			// TODO: Perform some wrork, write to the blob.
		}()
	}
	http.ListenAndServe("localhost:8888", nil)
}
Start the server, then use go tool to read and visualize the profile data:
$ go tool pprof http://localhost:8888/debug/pprof/blobstore.Open
(pprof) top
Showing nodes accounting for 800, 100% of 800 total
      flat  flat%   sum%        cum   cum%
       800   100%   100%        800   100%  main.main.func1 /Users/jbd/src/hello/main.go
You will see that there are 800 open blobs and all openings are coming from main.main.func1. In this small example, there is nothing more to see, but in a complex server you can examine the hottest spots that works with an open blob and find out bottlenecks or leaks.
Mon, May 22, 2017
Debugging is highly useful to examine the execution flow
and to understand the current state of a program.
A core file is a file that contains the memory dump of a running
process and its process status. It is primarily used for post-mortem
debugging of a program, as well as to understand a program’s state
while it is still running. These two cases make debugging of core dumps
a good diagnostics aid to postmortem and analyze production
services.
I will use a simple hello world web server in this article,
but in real life our programs might get very
complicated easily.
The availability of core dump analysis gives you an
opportunity to resurrect a program from specific snapshot
and look into cases that might only reproducible in certain
conditions/environments.
Note: This flow only works on Linux at this point end-to-end,
I am not quite sure about the other Unixes but it is not
yet supported on macOS. Windows is not supported at this point.
Before we begin, you need to make sure that your ulimit
for core dumps are at a reasonable level. It is by default
0 which means the max core file size can only be zero.
I usually set it to unlimited on my development machine by typing:
$ ulimit -c unlimited
Then, make sure you have delve
installed on your machine.
Here is a main.go that contains a simple handler and it starts an HTTP server.
$ cat main.go
package main

import (
	"fmt"
	"log"
	"net/http"
)

func main() {
	http.HandleFunc("/", func(w http.ResponseWriter, r *http.Request) {
		fmt.Fprint(w, "hello world\n")
	})
	log.Fatal(http.ListenAndServe("localhost:7777", nil))
}
Let’s build this and have a binary.
$ go build .
Let’s assume, in the future, there is something messy going on with
this server but you are not so sure about what it might be.
You might have instrumented your program in various ways but it
might not be enough for getting any clue from the existing
instrumentation data.
Basically, in a situation like this, it would be nice to have a
snapshot of the current process, and then use that snapshot to dive
into to the current state of your program with your existing debugging
tools.
There are several ways to obtain a core file. You might have been
already familiar with crash dumps, these are basically core dumps
written to disk when a program is crashing. Go doesn’t enable crash dumps
by default but gives you this option on Ctrl+backslash when
GOTRACEBACK env variable is set to “crash”.
$ GOTRACEBACK=crash ./hello
(Ctrl+\)
It will crash the program with stack trace printed and core dump file
will be written.
Another option is to retrieve a core dump from a running process
without having to kill a process.
With gcore, it is possible to get the core
files without crashing. Let’s start the server again:
$ ./hello &
$ gcore 546 # 546 is the PID of hello.
We have a dump without crashing the process. The next step
is to load the core file to delve and start analyzing.
$ dlv core ./hello core.546
Alright, this is it! This is no different than the typical delve interactive.
You can backtrace, list, see variables, and more. Some features will be disabled
given a core dump is a snapshot and not a currently running process, but
the execution flow and the program state will be entirely accessible.
(dlv) bt
 0  0x0000000000457774 in runtime.raise
    at /usr/lib/go/src/runtime/sys_linux_amd64.s:110
 1  0x000000000043f7fb in runtime.dieFromSignal
    at /usr/lib/go/src/runtime/signal_unix.go:323
 2  0x000000000043f9a1 in runtime.crash
    at /usr/lib/go/src/runtime/signal_unix.go:409
 3  0x000000000043e982 in runtime.sighandler
    at /usr/lib/go/src/runtime/signal_sighandler.go:129
 4  0x000000000043f2d1 in runtime.sigtrampgo
    at /usr/lib/go/src/runtime/signal_unix.go:257
 5  0x00000000004579d3 in runtime.sigtramp
    at /usr/lib/go/src/runtime/sys_linux_amd64.s:262
 6  0x00007ff68afec330 in (nil)
    at :0
 7  0x000000000040f2d6 in runtime.notetsleep
    at /usr/lib/go/src/runtime/lock_futex.go:209
 8  0x0000000000435be5 in runtime.sysmon
    at /usr/lib/go/src/runtime/proc.go:3866
 9  0x000000000042ee2e in runtime.mstart1
    at /usr/lib/go/src/runtime/proc.go:1182
10  0x000000000042ed04 in runtime.mstart
    at /usr/lib/go/src/runtime/proc.go:1152

(dlv) ls
> runtime.raise() /usr/lib/go/src/runtime/sys_linux_amd64.s:110 (PC: 0x457774)
   105:		SYSCALL
   106:		MOVL	AX, DI	// arg 1 tid
   107:		MOVL	sig+0(FP), SI	// arg 2
   108:		MOVL	$200, AX	// syscall - tkill
   109:		SYSCALL
=> 110:		RET
   111:
   112:	TEXT runtime·raiseproc(SB),NOSPLIT,$0
   113:		MOVL	$39, AX	// syscall - getpid
   114:		SYSCALL
   115:		MOVL	AX, DI	// arg 1 pid
Wed, Mar 22, 2017
In monolithic systems, it is relatively easy to collect diagnostic
data from the building blocks of a program. All modules live within
one process and share common resources to report logs and errors.
Once you are distributing your system into microservices, it becomes
harder to follow a call starting from the user’s entry point until a
response is served. To address this problem, Google invented
Dapper to instrument and analyze its production services. Dapper-like
distributed tracing systems allow you to trace a user request from
the entry point to the response.
Distribute tracing helps us to:
- Diagnose and improve latency problems.
- See the integration problems that are only visible in production.
- See the fundamental architectural problems, e.g. critical bottlenecks
that were not obvious without looking at the tracing data.
As a gRPC user, you are deploying distributed production services and
being able to trace a user request end-to-end can easily be a critical
fundamental requirement.
In this article, we are going to modify the helloworld
example from the gRPC Go package to add tracing.
Import the trace package:
import "cloud.google.com/go/trace"
Initiate a trace client:
ctx := context.Background()
tc, err := trace.NewClient(ctx, "project-id")
if err != nil {
    log.Fatal(err)
}
See the examples
to learn how to set the auth. In the example above,
we use the “Application Default Credentials”.
In order to initiate the greeter client, use the Stackdriver Trace
client interceptor we are providing:
conn, err := grpc.Dial(address, grpc.WithInsecure(), grpc.WithUnaryInterceptor(tc.GRPCClientInterceptor()))
if err != nil {
    log.Fatalf("did not connect: %v", err)
}
defer conn.Close()
c := pb.NewGreeterClient(conn)
All the outgoing requests from c will be automatically traced:
span := tc.NewSpan("/foo")
defer span.FinishWait() // use span.Finish() if your client is a long-running process.

ctx = trace.NewContext(ctx, span)
r, err := c.SayHello(ctx, &pb.HelloRequest{Name: name})
if err != nil {
    log.Fatalf("could not greet: %v", err)
}
On the server side, in order to be able to receive the traces (and keep propagating), use the server interceptor we are providing when initializing
a server:
s := grpc.NewServer(grpc.UnaryInterceptor(tc.GRPCServerInterceptor()))
Then, the server handlers will be able to access the trace.Span
instances from the current calling context:
func (s *server) SayHello(ctx context.Context, in *pb.HelloRequest) (*pb.HelloReply, error) {
	span := trace.FromContext(ctx)
    // TODO: Use the span directly or keep using the context
    // to make more outgoing calls from this handler.
    // If you don't finish the span, it will be auto-finished
    // once this function returns.

	return &pb.HelloReply{Message: "Hello " + in.Name}, nil
}
A single-hop from the client to server looks like below on the
Stackdriver Trace console:

But things are getting more exciting as you begin to depend on
more services to serve your user requests:

Similar to the gRPC interceptors, I also contributed a few HTTP utilities
to enable tracing support for your HTTP-speaking microservices.
See NewHTTPClient and
HTTPHandler
for more information and examples.
What’s next?
In the past few months, I have been privileged to work on Go distributed tracing
APIs on a part-time basis. We experimented a lot, addressed many critical open
questions, and worked hard to achieve a very minimal backend-agnostic tracing
API for the entire Go ecosystem.
Achieving common APIs will make distributed tracing more accessible, make our
libraries trace-aware and create opportunity to reuse our utilities. I am looking forward to share this work in the upcoming weeks.
Fri, Feb 3, 2017
Go doesn’t specifically enforce you how you choose your test names.
Tests are a significant contributors for the maintainability
of your code. Tests not just providing correctness checking
but also are useful in self documenting your code and its usage.
On top of that, tests are the single best source to read about
responsibilities of a type, function, etc.
This is where naming tests better can help the internal documentation
and therefore the maintainability of your code.
Emphasize the role of what you are testing rather than naming
after the inputs and outputs.
func TestTitleIllegalChar(t *testing.T) {}
Instead, explain that the doc needs to be able to escape illegal
characters on edit.
func TestTitleEscape(t *testing.T) {}
With this rename, we also self-document how the illegal characters
on the title will be handled.
We sometimes pick very inclusive test names and write big table-driven
tests. If you are running table-driven tests, you can convert them to
subtests and name the individual cases.
Then go test -v can pick those name and its output will act as a spec of
your type, function, etc.
Sat, Jan 14, 2017
Go is about naming and organization as much as everything else in the language.
Well-organized Go code is easy to discover,
use and read. Well-organized code is as critical as well designed APIs. The location, name,
and the structure of your packages are the first elements your users see and interact with.
This document’s goal is to guide you with common good practices not to set rules.
You will always need to use your own judgement to pick the most elegant solution
for your specific case.
Packages
All Go code is organized into packages. A package in Go is simply a directory/folder with one or more
.go files inside of it. Go packages provide isolation and organization of code similar to
how directories/folders organize files on a computer.
All Go code lives in a package and a package is the entry point to access Go code. Understanding
and establishing good practices around packages is important to write effective Go code.
Package Organization
Let’s begin with suggestions how you should organize Go code and explain conventions about
locating Go packages.
Use multiple files
A package is a directory with one or more Go files.
Feel free to separate your code into as many files as logically
make sense for optimal readability.
For example, an HTTP package might have been separated into different files
according to the HTTP aspect the file handles.
In the following example, an HTTP package is broken down into a few files:
header types and code, cookie types and code, the actual HTTP implementation, and
documentation of the package.
- doc.go       // package documentation
- headers.go   // HTTP headers types and code
- cookies.go   // HTTP cookies types and code
- http.go      // HTTP client implementation, request and response types, etc.
Keep types close
As a rule of thumb, keep types closer to where they are used. This makes it easy for
any maintainer (not just the original author) to find a type.
A good place for a Header struct type might be in headers.go.
$ cat headers.go
package http

// Header represents an HTTP header.
type Header struct {...}
Even though, the Go language doesn’t restrict where you define types,
it is often a good practice to keep the core types grouped at the top of a file.
Organize by responsibility
A common practise from other languages is to organize types together in a package
called models or types. In Go, we organize code by their functional responsibilities.
package models // DON'T DO IT!!!

// User represents a user in the system.
type User struct {...}
Rather than creating a models package and declare all entity types there,
a User type should live in a service-layer package.
package mngtservice

// User represents a user in the system.
type User struct {...}

func UsersByQuery(ctx context.Context, q *Query) ([]*User, *Iterator, error)

func UserIDByEmail(ctx context.Context, email string) (int64, error)
Optimize for godoc
It is a great exercise to use godoc in the early phases of your package’s API design to see
how your concepts will be rendered on doc. Sometimes, the visualization also has an impact
on the design. Godoc is the way your users will consume a package, so it is ok to tweak
things to make them more accessible. Run godoc -http=<hostport> to start a godoc server locally.
Provide examples to fill the gaps
In some cases, you may not be able to provide all related types from a single package. It might be noisy
to do so, or you might want to publish concrete implementations of a common interface from a separate
package, or those types could be owned by a third-party package.
Give examples to help the user to discover and understand how they are used together.
$ godoc cloud.google.com/go/datastore
func NewClient(ctx context.Context, projectID string, opts ...option.ClientOption) (*Client, error)
...
NewClient works with option.ClientOptions but it is neither the datastore package
nor the option package that export all the option types.
$ godoc google.golang.org/extraoption
func WithCustomValue(v string) option.ClientOption
...
If your API requires many non-standard packages to be imported, it is often useful to add
a Go example to give your users some working code.
Examples are a good way to increase visibility of a less discoverable package.
For example, an example for datastore.NewClient might reference the extraoption package.
Don’t export from main
An identifier may be exported
to permit access to it from another package.
Main packages are not importable, so exporting identifiers from main packages is unnecessary.
Don’t export identifiers from a main package if you are building the package to a binary.
Exceptions to this rule might be the main packages built into a .so, or a .a or Go plugin.
In such cases, Go code might be used from other languages via
cgo’s export functionality
and exporting identifiers are required.
Package Naming
A package name and import path are both significant identifiers of your package
and represent everything your package contains. Naming your packages canonically
not just improves your code quality but also your users'.
Lowercase only
Package names should be lowercase. Don’t use snake_case or camelCase in package names.
The Go blog has a comprehensive guide about naming packages
with a good variety of examples.
Short, but representative names
Package names should be short, but should be unique and representative.
Users of the package should be able to grasp its purpose from just the package’s name.
Avoid overly broad package names like “common” and “util”.
import "pkgs.org/common" // DON'T!!!
Avoid duplicate names in cases where user may need to import the same package.
If you cannot avoid a bad name, it is very likely that there is a problem
with your overall structure and code organization.
Clean import paths
Avoid exposing your custom repository structure to your users. Align
well with the GOPATH conventions. Avoid having src/, pkg/
sections in your import paths.
github.com/user/repo/src/httputil   // DON'T DO IT, AVOID SRC!!

github.com/user/repo/gosrc/httputil // DON'T DO IT, AVOID GOSRC!!
No plurals
In go, package names are not plural. This is surprising to programmers who came
from other languages and are retaining an old habit of pluralizing names.
Don’t name a package httputils, but httputil!
package httputils // DON'T DO IT, USE SINGULAR FORM!!
Renames should follow the same rules
If you are importing more than one packages with the same name, you can locally
rename the package names. The renames should follow the same rules mentioned
on this article. There is no rule which package you should rename. If you are
renaming the standard package library, it is nice to add a go prefix to make the name
self document that it is “Go standard library’s” package, e.g. gourl, goioutil.
import (
    gourl "net/url"

    "myother.com/url"
)
Enforce vanity URLs
go get supports getting packages by a URL that is different than the URL
of the package’s repo. These URLs are called vanity URLs and require you to
serve a page with specific meta tags the Go tools recognize.
You can serve a package with a custom domain and path using vanity URLs.
For example,
$ go get cloud.google.com/go/datastore
checks out the source code from https://code.googlesource.com/gocloud behind
the scenes and puts it in your workspace under $GOPATH/src/cloud.google.com/go/datastore.
Given code.googlesource.com/gocloud is already serving this package, would it
be possible to go get the package from that URL? The answer is no, if you enforce
the vanity URL.
To do that, add an import statement to the package. The go tool will reject
any import of this package from any other path and will display a friendly
error to the user. If you don’t enforce your vanity URLs, there will be two
copies of your package that cannot work together due to the different namespace.
package datastore // import "cloud.google.com/go/datastore"
Package Documentation
Always document the package. Package documentation is a top-level comment
immediately preceding the package clause. For non-main packages, godoc always starts with
“Package {pkgname}” and follows with a description. For main packages, documentation
should explain the binary.
// Package ioutil implements some I/O utility functions.
package ioutil

// Command gops lists all the processes running on your system.
package main

// Sample helloworld demonstrates how to use x.
package main
Use doc.go
Sometimes, package docs can get very lengthy, especially when they provide details
of usage and guidelines.
Move the package godoc to a doc.go file.
(See an example of a doc.go.)
Wed, Jan 11, 2017
Go 1.8 is going to to launched in February 2017. There is a sizable list of
new features and improvements on the release notes.
While these notes is the best summary to see what has happened in the last 6 months,
I will try to give you some stats to give you a sense of the size of the work.
I have examined all the changes merged into the tree during the Go 1.8 window and
will highlight some of the interesting and significant ones.
There has been 2049 commits I have examined to gather these results.
c/35111 is the last commit
I have included in the data set.
Contributors
There have been 201 contributors involved during the development of 1.8 👏👏👏
But, more than 55% of the commits came from the top 10 contributors.
| Author               | Changes |
|----------------------|---------|
| Brad Fitzpatrick     | 225     |
| Russ Cox             | 140     |
| Josh Bleecher Snyder | 137     |
| Robert Griesemer     | 129     |
| Ian Lance Taylor     | 117     |
| Austin Clements      | 111     |
| Matthew Dempsky      | 94      |
| David Crawshaw       | 69      |
| Keith Randall        | 65      |
| Cherry Zhang         | 55      |
There is only one non-Googler in the top 10, Josh Bleecher Snyder.
Reviews
Go has a reputation of having comprehensive and thoughtful code reviews.
Each change list needs at least one reviewer, for controversial topics the number grows easily.
The average number of reviewers for each change was 3.41 people during this cycle.
1160 changes got a LGTM without anyone requiring to leave any comment,
most of these changes are coming from already tenured contributors.
There also have been noisier changes. Top three of them with most reviewers are:
- c/16551: Addition of os.Executable
- c/29397: Far jumps are handled on ARM, big ARM binaries are fine now.
- c/32019: Implementation of the default GOPATH
The average number of comments left on a change is 3.51.
Half of the changes took 8 hours or less to submit from its creation.
Of course, there been some long standing changes that have waited for long
(even for a year) and finally made their way to this release but the
review stage has been quite productive in most cases.
Size
The size of a change is the sum of lines added and lines deleted.
Average size for a change during 1.8 development was 190.73 lines.
If you look at the distribution though, half of the changes are
smaller than 25 lines.
The biggest changes
Most sizeable changes are often going to the compiler. Here are the top 3 biggest changes in 1.8:
- c/29168: Deletion of the old compiler backend
- c/28978: SSA backend for s390x
- c/31478: SSA backend for mips
Minor fixes
How many times you have spotted a problem but ignored it because you were ashamed
of opening a single line commit? There are 390 changes that are under 5 lines in 1.8.
There is no such thing called little contribution in Go, almost 20% of the
changes were teeny-tiny.
Mon, Dec 19, 2016
Go 1.8 introduces a new profile, the contended mutex profile, that allows you to
capture a fraction of the stack traces of goroutines with contended mutexes.
You need to set the sampling fraction by calling
runtime.SetMutexProfileFraction
to a value above zero to enable collection.
Consider the following program:
import _ "net/http/pprof"

var mu sync.Mutex
var items = make(map[int]struct{})

runtime.SetMutexProfileFraction(5)
for i := 0; i < 1000*1000; i++ {
    go func(i int) {
        mu.Lock()
        defer mu.Unlock()

        items[i] = struct{}{}
    }(i)
}

http.ListenAndServe(":8888", nil)
Run the program, http://localhost:8888/debug/pprof/mutex will
serve the mutex profile. Then, you can use go tool pprof to examine the profile.
$ go tool pprof <binary> http://localhost:8888/debug/pprof/mutex?debug=1
Fetching profile from http://localhost:8888/debug/pprof/mutex
Saved profile in /Users/jbd/pprof/pprof.mutexprofile.localhost:8888.contentions.delay.002.pb.gz
Entering interactive mode (type "help" for commands)
(pprof) list
Total: 27.15s
ROUTINE ======================== main.main.func1 in /Users/jbd/src/hello/mutexprofile/main.go
         0     27.15s (flat, cum)   100% of Total
         .          .     18:		go func() {
         .          .     19:			mu.Lock()
         .          .     20:			defer mu.Unlock()
         .          .     21:
         .          .     22:			items[i] = struct{}{}
         .     27.15s     23:		}()
         .          .     24:	}
         .          .     25:	http.ListenAndServe(":8888", nil)
         .          .     26:}
ROUTINE ======================== runtime.goexit in /Users/jbd/go/src/runtime/asm_amd64.s
         0     27.15s (flat, cum)   100% of Total
         .          .   2179:	RET
         .          .   2180:
         .          .   2181:// The top-most function running on a goroutine
         .          .   2182:// returns to goexit+PCQuantum.
         .          .   2183:TEXT runtime·goexit(SB),NOSPLIT,$0-0
         .     27.15s   2184:	BYTE	$0x90	// NOP
         .          .   2185:	CALL	runtime·goexit1(SB)	// does not return
         .          .   2186:	// traceback from goexit1 must hit code range of goexit
         .          .   2187:	BYTE	$0x90	// NOP
         .          .   2188:
         .          .   2189:TEXT runtime·prefetcht0(SB),NOSPLIT,$0-8
ROUTINE ======================== sync.(*Mutex).Unlock in /Users/jbd/go/src/sync/mutex.go
    27.15s     27.15s (flat, cum)   100% of Total
         .          .    121:			return
         .          .    122:		}
         .          .    123:		// Grab the right to wake someone.
         .          .    124:		new = (old - 1<<mutexWaiterShift) | mutexWoken
         .          .    125:		if atomic.CompareAndSwapInt32(&m.state, old, new) {
    27.15s     27.15s    126:			runtime_Semrelease(&m.sema)
         .          .    127:			return
         .          .    128:		}
         .          .    129:		old = m.state
         .          .    130:	}
         .          .    131:}
The fraction is automatically set in tests if -mutexprofile is used. Set
the flag to write the profile to a file.
go test -mutexprofile=mutex.out
Then, the pprof tool can be used to examine the recorded profile.
go tool pprof <test.binary> mutex.out
See the runtime/pprof package for more details about profiling
and the predefined profiles.
The State of Go 2017 talk
also contains a guide how to run benchmarks while capturing the mutex profile. It is worth to take a
look if you are willing to write benchmarks.
Happy profiling!
Wed, Dec 14, 2016
Go 1.8 will set a default GOPATH if the GOPATH env variable is not set.
The requirement of setting a GOPATH has been a major issue for Go users
who installed the Go tools for the first time and got the
“you have to set a GOPATH” error in their initial experience with the tools.
Explaining the GOPATH is and instructing how to set this env variable were both
distracting new users away from using Go. This was especially true for users who
are not necessarily developing in Go but using go get to download commands.
Go 1.8 is introducing a default GOPATH.
If you don’t set one, the tools will use the default. Default GOPATH is:
- $HOME/go on Unix-like systems
- %USERPROFILE%\go on Windows
Even though you don’t have care about setting this variable, there are few items
that still requires your attention.
- Users still need to add $GOPATH/bin into their PATH to run binaries installed by
go get and go install.
- The users who are developing with the Go language still need to understand
that the presence of GOPATH, its location and its structure.
- If your GOROOT (the location where you checkout the Go’s source code)
is the default GOPATH and if you don’t have a GOPATH set, the
tools will reject to use the default GOPATH not to corrupt your GOROOT.
You still may prefer to set a custom GOPATH
if the default is not working for you.
If a custom GOPATH is set, go env GOPATH will report its value.
Sat, Dec 10, 2016
Go 1.8 is going to feature support for HTTP/2 server push.
HTTP/2 has many features designed to make the Web faster. One of those features
is the server push, the ability to send resources before the client asks for it.
This feature enables websites to push assets like JavaScript and CSS files
before waiting for the web page to be loaded and asking for those resources.
net/http package will support server push by exposing a Pusher API
that will be supported by HTTP/2 ResponseWriters. This interface is only implemented when HTTP/2 is available.
In the following handler, we will push main.js rather than waiting for the page to load
and invoke the request itself.
const indexHTML = `<html>
<head>
	<title>Hello</title>
	<script src="/main.js"></script>
</head>
<body>
</body>
</html>
`

http.HandleFunc("/", func(w http.ResponseWriter, r *http.Request) {
    if r.URL.Path != "/" {
        http.NotFound(w, r)
        return
    }
    pusher, ok := w.(http.Pusher)
    if ok { // Push is supported. Try pushing rather than waiting for the browser.
        if err := pusher.Push("/main.js", nil); err != nil {
            log.Printf("Failed to push: %v", err)
        }
    }
    fmt.Fprintf(w, indexHTML)
})
In the Network tab, you can see that the JavaScript file is loaded by server push rather
than a GET request.

Push support will be available in Go 1.8
that is available as beta,
download and give this a try. A full sample program can by found on this gist.
Thu, Dec 8, 2016
In Go, for a long time, we didn’t have a convention to label the deprecated APIs.
In the past years, there is new convention emerged to add deprecation notices to the docs.
Today, standard library uses this specific format.
As an example, Go 1.8 deprecates sql/driver.Execer
and adds a deprecation notice to its godoc.
// Execer is an optional interface that may be implemented by a Conn.
//
// If a Conn does not implement Execer, the sql package's DB.Exec will
// first prepare a query, execute the statement, and then close the
// statement.
//
// Exec may return ErrSkip.
//
// Deprecated: Drivers should implement ExecerContext instead (or additionally).
type Execer interface {
	Exec(query string, args []Value) (Result, error)
}
The deprecation notice should be in the godoc, begin with string “Deprecated: " and follow with
a tip for replacement.
// Deprecated: Use strings.HasPrefix instead.
User are expected to follow the tip and switch to the new recommended API.
Additional to the notices, there is an effort going on to discourage users
to keep depending on the deprecated APIs.
See the following items for the ongoing work:
In conclusion, please use this specific format to add deprecation notices. Not “DEPRECATED” or
not “This type is deprecated”. Soon, you will be able to enjoy the tooling support that yells at your
users to stop depending on your deprecated APIs.
Tue, Oct 25, 2016
The context package makes it possible
to manage a chain of calls within the same call path by signaling context’s
Done channel.
In this article, we will examine how to use the context package to
avoid leaking goroutines.
Assume, you have a function that starts a goroutine internally. Once this
function is called, the caller may not be able to terminate the goroutine
started by the function.
// gen is a broken generator that will leak a goroutine.
func gen() <-chan int {
	ch := make(chan int)
	go func() {
		var n int
		for {
			ch <- n
			n++
		}
	}()
	return ch
}
The generator above starts a goroutine with an infinite loop,
but the caller consumes the values until n is equal to 5.
// The call site of gen doesn't have a
for n := range gen() {
    fmt.Println(n)
    if n == 5 {
        break
    }
}
Once the caller is done with the generator (when it breaks the loop),
the goroutine will run forever executing the infinite loop. Our code
will leak a goroutine.
We can avoid the problem by signaling the internal goroutine with a
stop channel but there is a better solution: cancellable contexts.
The generator can select on a context’s Done channel and once the context is
done, the internal goroutine can be cancelled.
// gen is a generator that can be cancellable by cancelling the ctx.
func gen(ctx context.Context) <-chan int {
	ch := make(chan int)
	go func() {
		var n int
		for {
			select {
			case <-ctx.Done():
				return // avoid leaking of this goroutine when ctx is done.
			case ch <- n:
				n++
			}
		}
	}()
	return ch
}
Now, the caller can signal the generator when it is done consuming.
Once cancel function is called, the internal goroutine will be returned.
ctx, cancel := context.WithCancel(context.Background())
defer cancel() // make sure all paths cancel the context to avoid context leak

for n := range gen(ctx) {
    fmt.Println(n)
    if n == 5 {
        cancel()
        break
    }
}

// ...
The full program is available as a gist.
Sat, Oct 15, 2016
Last week, I was at dotGo.
I gave a very short lightning talk about inspection of code generation
with the tools already available in the toolchain. This post goes through the talk for
those who didn’t have the privilege to be at the conference. Slides are also
available at go-talks.
Throughout this article, we will use the following program:
package main

import "fmt"

func main() {
    sum := 1 + 1
    fmt.Printf("sum: %v\n", sum)
}
Go build command encapsulates a bunch of underlying tools such as
the compiler and the linker.
But, it also provides more details about the build process optionally.
-x is a flag that makes go build output what is being invoked.
If you want to see what the components of the toolchain are,
which sequence they are invoked and which flags being used, use -x.
$ go build -x
WORK=/var/folders/00/1b8h8000h01000cxqpysvccm005d21/T/go-build190726544
mkdir -p $WORK/hello/_obj/
mkdir -p $WORK/hello/_obj/exe/
cd /Users/jbd/src/hello
/Users/jbd/go/pkg/tool/darwin_amd64/compile -o $WORK/hello.a -trimpath $WORK -p main -complete -buildid d934a5702088e0fe5c931a55ff26bec87b80cbdc -D _/Users/jbd/src/hello -I $WORK -pack ./hello.go
cd .
/Users/jbd/go/pkg/tool/darwin_amd64/link -o $WORK/hello/_obj/exe/a.out -L $WORK -extld=clang -buildmode=exe -buildid=d934a5702088e0fe5c931a55ff26bec87b80cbdc $WORK/hello.a
mv $WORK/hello/_obj/exe/a.out hello
In Go, there is an intermediate assembly phase before generating the actual platform-specific assembly.
The compiler takes some Go files, generates the intermediate instructions and escalates it to the obj package to generate the machine code.
If you are curious about what compiler generates in this phase, -S makes the compiler dump the output.
The intermediate assembly is generally a good reference to understand the cost of a Go line.
Or it could be be a great reference if you want to replace, let’s say, a Go function with a more optimized assembly equivalent.
You are seeing the output for the main.main here.
$ go build -gcflags="-S"
# hello
"".main t=1 size=179 args=0x0 locals=0x60
    0x0000 00000 (/Users/jbd/src/hello/hello.go:5)	TEXT	"".main(SB), $96-0
    0x0000 00000 (/Users/jbd/src/hello/hello.go:5)	MOVQ	(TLS), CX
    0x0009 00009 (/Users/jbd/src/hello/hello.go:5)	CMPQ	SP, 16(CX)
    0x000d 00013 (/Users/jbd/src/hello/hello.go:5)	JLS	169
    0x0013 00019 (/Users/jbd/src/hello/hello.go:5)	SUBQ	$96, SP
    0x0017 00023 (/Users/jbd/src/hello/hello.go:5)	MOVQ	BP, 88(SP)
    0x001c 00028 (/Users/jbd/src/hello/hello.go:5)	LEAQ	88(SP), BP
    0x0021 00033 (/Users/jbd/src/hello/hello.go:5)	FUNCDATA	$0, gclocals·69c1753bd5f81501d95132d08af04464(SB)
    0x0021 00033 (/Users/jbd/src/hello/hello.go:5)	FUNCDATA	$1, gclocals·e226d4ae4a7cad8835311c6a4683c14f(SB)
    0x0021 00033 (/Users/jbd/src/hello/hello.go:7)	MOVQ	$2, "".autotmp_1+64(SP)
    0x002a 00042 (/Users/jbd/src/hello/hello.go:7)	MOVQ	$0, "".autotmp_0+72(SP)
    0x0033 00051 (/Users/jbd/src/hello/hello.go:7)	MOVQ	$0, "".autotmp_0+80(SP)
    0x003c 00060 (/Users/jbd/src/hello/hello.go:7)	LEAQ	type.int(SB), AX
    0x0043 00067 (/Users/jbd/src/hello/hello.go:7)	MOVQ	AX, (SP)
    0x0047 00071 (/Users/jbd/src/hello/hello.go:7)	LEAQ	"".autotmp_1+64(SP), AX
    0x004c 00076 (/Users/jbd/src/hello/hello.go:7)	MOVQ	AX, 8(SP)
    0x0051 00081 (/Users/jbd/src/hello/hello.go:7)	PCDATA	$0, $1
    0x0051 00081 (/Users/jbd/src/hello/hello.go:7)	CALL	runtime.convT2E(SB)
    0x0056 00086 (/Users/jbd/src/hello/hello.go:7)	MOVQ	16(SP), AX
    0x005b 00091 (/Users/jbd/src/hello/hello.go:7)	MOVQ	24(SP), CX
    0x0060 00096 (/Users/jbd/src/hello/hello.go:7)	MOVQ	AX, "".autotmp_0+72(SP)
    0x0065 00101 (/Users/jbd/src/hello/hello.go:7)	MOVQ	CX, "".autotmp_0+80(SP)
    0x006a 00106 (/Users/jbd/src/hello/hello.go:7)	LEAQ	go.string."sum: %v\n"(SB), AX
    0x0071 00113 (/Users/jbd/src/hello/hello.go:7)	MOVQ	AX, (SP)
    0x0075 00117 (/Users/jbd/src/hello/hello.go:7)	MOVQ	$8, 8(SP)
    0x007e 00126 (/Users/jbd/src/hello/hello.go:7)	LEAQ	"".autotmp_0+72(SP), AX
    0x0083 00131 (/Users/jbd/src/hello/hello.go:7)	MOVQ	AX, 16(SP)
    0x0088 00136 (/Users/jbd/src/hello/hello.go:7)	MOVQ	$1, 24(SP)
    0x0091 00145 (/Users/jbd/src/hello/hello.go:7)	MOVQ	$1, 32(SP)
    0x009a 00154 (/Users/jbd/src/hello/hello.go:7)	PCDATA	$0, $1
    0x009a 00154 (/Users/jbd/src/hello/hello.go:7)	CALL	fmt.Printf(SB)
    0x009f 00159 (/Users/jbd/src/hello/hello.go:8)	MOVQ	88(SP), BP
    0x00a4 00164 (/Users/jbd/src/hello/hello.go:8)	ADDQ	$96, SP
    0x00a8 00168 (/Users/jbd/src/hello/hello.go:8)	RET
    0x00a9 00169 (/Users/jbd/src/hello/hello.go:8)	NOP
    0x00a9 00169 (/Users/jbd/src/hello/hello.go:5)	PCDATA	$0, $-1
    0x00a9 00169 (/Users/jbd/src/hello/hello.go:5)	CALL	runtime.morestack_noctxt(SB)
    0x00ae 00174 (/Users/jbd/src/hello/hello.go:5)	JMP	0
    ...
If you would like to learn more insights about the intermediate assembly and why
it is significant in Go, I highly recommend
Rob Pike’s The Design of the Go Assembler
from GopherCon this year.
Disassembler
As I mentioned, -S is only for the intermediate assembly. The actual machine representation is available in the final artifact.
You can use a disassembler to examine what’s inside.
Use go tool objdump with a binary or library. You probably also want to use -s to focus by symbol name.
In this example, I am dumping the main.main. This is the actual assembly generated for darwin/amd64.
$ go tool objdump -s main.main hello
TEXT main.main(SB) /Users/jbd/src/hello/hello.go
    hello.go:5	0x2040	65488b0c25a0080000  GS MOVQ GS:0x8a0, CX
    hello.go:5	0x2049	483b6110            CMPQ 0x10(CX), SP
    hello.go:5	0x204d	0f8696000000        JBE 0x20e9
    hello.go:5	0x2053	4883ec60            SUBQ $0x60, SP
    hello.go:5	0x2057	48896c2458          MOVQ BP, 0x58(SP)
    hello.go:5	0x205c	488d6c2458          LEAQ 0x58(SP), BP
    hello.go:7	0x2061	48c744244002000000  MOVQ $0x2, 0x40(SP)
    hello.go:7	0x206a	48c744244800000000  MOVQ $0x0, 0x48(SP)
    hello.go:7	0x2073	48c744245000000000  MOVQ $0x0, 0x50(SP)
    hello.go:7	0x207c	488d053d4d0800      LEAQ 0x84d3d(IP), AX
    ...
Symbols
Sometimes, all you need is to check the symbols rather than understand the code or data sections.
Similar to the general-purpose nm tool, Go distributes an nm which allows you to list the symbols in an artifact with annotations and size.
Pretty handy if you want to see what’s in and being exported from a Go binary or library.
$ go tool nm hello
...
f4760 B __cgo_init
f4768 B __cgo_notify_runtime_init_done
f4770 B __cgo_thread_start
4fb70 T __rt0_amd64_darwin
4e220 T _gosave
4fb90 T _main
ad1e0 R _masks
4fd00 T _nanotime
4e480 T _setg_gcc
ad2e0 R _shifts
624a0 T errors.(*errorString).Error
62400 T errors.New
52470 T fmt.(*buffer).WriteRune
...
Optimizations
Optimizations: SSA steps
With the contribution of the new SSA backend, the team contributed a tool that visualizes all the SSA passes.
Set the GOSSAFUNC env variable with a func name and run the go build command.
It will generate an ssa.html file that shows all the steps the compiler has gone through to optimize your code.
$ GOSSAFUNC=main go build && open ssa.html
Here, there is a visualization of all the passes applied to the main function.

Optimizations: Escape analysis
The Go compiler can also annotate the inlining and escape analysis.
If you pass the -m=2 flag to the compiler, it will output the optimizations or annotations related to these two.
Here we see the net/context package related inlining operations and escape analysis.
$ go build -gcflags="-m" golang.org/x/net/context
# golang.org/x/net/context
../golang.org/x/net/context/context.go:140: can inline Background as: func() Context { return background }
../golang.org/x/net/context/context.go:149: can inline TODO as: func() Context { return todo }
../golang.org/x/net/context/go17.go:32: cannot inline WithCancel: non-leaf function
../golang.org/x/net/context/go17.go:46: cannot inline WithDeadline: non-leaf function
../golang.org/x/net/context/go17.go:61: cannot inline WithTimeout: non-leaf function
../golang.org/x/net/context/go17.go:62: inlining call to time.Time.Add method(time.Time) func(time.Duration) time.Time { time.t·2.sec += int64(time.d·3 / time.Duration(1000000000)); var time.nsec·4 int32; time.nsec·4 = <N>; time.nsec·4 = time.t·2.nsec + int32(time.d·3 % time.Duration(1000000000)); if time.nsec·4 >= int32(1000000000) { time.t·2.sec++; time.nsec·4 -= int32(1000000000) } else { if time.nsec·4 < int32(0) { time.t·2.sec--; time.nsec·4 += int32(1000000000) } }; time.t·2.nsec = time.nsec·4; return time.t·2 }
../golang.org/x/net/context/go17.go:70: cannot inline WithValue: non-leaf function
../golang.org/x/net/context/context.go:141: background escapes to heap
../golang.org/x/net/context/context.go:141: 	from ~r0 (return) at ../golang.org/x/net/context/context.go:140
../golang.org/x/net/context/context.go:150: todo escapes to heap
../golang.org/x/net/context/context.go:150: 	from ~r0 (return) at ../golang.org/x/net/context/context.go:149
../golang.org/x/net/context/go17.go:33: parent escapes to heap
../golang.org/x/net/context/go17.go:33: 	from parent (passed to function[unknown]) at ../golang.org/x/net/context/go17.go:33
../golang.org/x/net/context/go17.go:32: leaking param: parent
../golang.org/x/net/context/go17.go:32: 	from parent (interface-converted) at ../golang.org/x/net/context/go17.go:33
../golang.org/x/net/context/go17.go:32: 	from parent (passed to function[unknown]) at ../golang.org/x/net/context/go17.go:33
../golang.org/x/net/context/go17.go:47: parent escapes to heap
../golang.org/x/net/context/go17.go:47: 	from parent (passed to function[unknown]) at ../golang.org/x/net/context/go17.go:47
../golang.org/x/net/context/go17.go:46: leaking param: parent
../golang.org/x/net/context/go17.go:46: 	from parent (interface-converted) at ../golang.org/x/net/context/go17.go:47
../golang.org/x/net/context/go17.go:46: 	from parent (passed to function[unknown]) at ../golang.org/x/net/context/go17.go:47
../golang.org/x/net/context/go17.go:46: leaking param: deadline
../golang.org/x/net/context/go17.go:46: 	from deadline (passed to function[unknown]) at ../golang.org/x/net/context/go17.go:46
../golang.org/x/net/context/go17.go:48: ctx escapes to heap
../golang.org/x/net/context/go17.go:48: 	from ~r2 (return) at ../golang.org/x/net/context/go17.go:46
../golang.org/x/net/context/go17.go:61: leaking param: parent
../golang.org/x/net/context/go17.go:61: 	from parent (passed to function[unknown]) at ../golang.org/x/net/context/go17.go:61
../golang.org/x/net/context/go17.go:71: parent escapes to heap
../golang.org/x/net/context/go17.go:71: 	from parent (passed to function[unknown]) at ../golang.org/x/net/context/go17.go:71
../golang.org/x/net/context/go17.go:70: leaking param: parent
../golang.org/x/net/context/go17.go:70: 	from parent (interface-converted) at ../golang.org/x/net/context/go17.go:71
../golang.org/x/net/context/go17.go:70: 	from parent (passed to function[unknown]) at ../golang.org/x/net/context/go17.go:71
../golang.org/x/net/context/go17.go:70: leaking param: key
../golang.org/x/net/context/go17.go:70: 	from key (passed to function[unknown]) at ../golang.org/x/net/context/go17.go:70
../golang.org/x/net/context/go17.go:70: leaking param: val
../golang.org/x/net/context/go17.go:70: 	from val (passed to function[unknown]) at ../golang.org/x/net/context/go17.go:70
../golang.org/x/net/context/go17.go:71: context.WithValue(parent, key, val) escapes to heap
../golang.org/x/net/context/go17.go:71: 	from ~r3 (return) at ../golang.org/x/net/context/go17.go:70
<autogenerated>:1: leaking param: .this
<autogenerated>:1: 	from .this.Deadline() (receiver in indirect call) at <autogenerated>:1
<autogenerated>:2: leaking param: .this
<autogenerated>:2: 	from .this.Done() (receiver in indirect call) at <autogenerated>:2
<autogenerated>:3: leaking param: .this
<autogenerated>:3: 	from .this.Err() (receiver in indirect call) at <autogenerated>:3
<autogenerated>:4: leaking param: key
<autogenerated>:4: 	from .this.Value(key) (parameter to indirect call) at <autogenerated>:4
<autogenerated>:4: leaking param: .this
<autogenerated>:4: 	from .this.Value(key) (receiver in indirect call) at <autogenerated>:4
You can use -m to see a less verbose output without reasonings, but David Chase says
even though -m=2 is not perfect, it is often useful.
Optimizations: Disabling optimizations
It is worth it to mention that you may prefer to disable optimizations to insepect certain cases because optimization can change the sequence of operations, add code, remove code or apply transformations to the code.
With optimizations, it may get harder to debug and insect certain cases.
Disabling optimizations is possible with -N, and disabling inlining is possible with -l.
$ go build -gcflags="-l -N"
Once optimizations are disabled, you can debug without being affected by transformations.
Lexer
If you are working on the lexer, the compiler provides a flag to debug
the lexer as it goes through the source files.
$ go build -gcflags="-x"
# hello
lex: PACKAGE
lex: ident main
lex: implicit semi
lex: IMPORT
lex: string literal
lex: implicit semi
lex: FUNC
lex: ident main
./hello.go:5 lex: TOKEN '('
./hello.go:5 lex: TOKEN ')'
./hello.go:5 lex: TOKEN '{'
lex: ident sum
./hello.go:6 lex: TOKEN COLAS
lex: integer literal
./hello.go:6 lex: TOKEN '+'
lex: integer literal
lex: implicit semi
lex: ident fmt
./hello.go:7 lex: TOKEN '.'
lex: ident Printf
./hello.go:7 lex: TOKEN '('
lex: string literal
./hello.go:7 lex: TOKEN ','
lex: ident sum
./hello.go:7 lex: TOKEN ')'
lex: implicit semi
./hello.go:8 lex: TOKEN '}'
lex: implicit semi
Tue, Oct 11, 2016
Disclaimer: I forked my opinions on this one from a barely readable Twitter thread
and wanted to write it down how I feel about keeping the language internals away
from the users, especially from the newcomers. This is not a skill-level concern,
it is a core goal of Go to provide a high-level programming language that saves users from
excessive mental overhead. Note that these
are personal opinions and are not written on the behalf of a group.
Go is a highly opiniated language when it comes to API design,
readability and human-first approach.
It is critical to understand these aspects and the history of the language
before deep diving into more.
Go is created at Google to make engineers more productive and do more without
mental overload. Go wishes that behavior is predictable from a human perspective,
rather than humans are being enforced to think like machines to be efficient and productive.
Go sets the same high bar for its runtime. Go wishes to be good enough
to be doing the right for the most of the time – anything else can be optimized.
It is highly critical for us to keep Go users having
high expectations that things will work out of the box, and escalating major problems
to the team where the promise is not matching the actual behavior. Go is far away from being
a perfect language. It is important not to be sold so quickly and participate in the future of the
language if you are already skilled to understand the internals and their pitfalls.
I encourage our users to report bugs rather than creating
extensive documentation around how to hack the current limitations for the short-term gain.
There is much space for improvement in Go and the team desperately needs actual feedback from
actual users to commit work in the right direction.
Go needs to understand its users rather than users having to understand
every aspect of the language. This is the only scalable
approach.
Maybe along the way, our core goal of creating a human-first language will
be challenged, but I believe Go has proven that a language can be high-level,
precise and performant at the same time. I see no reason we should give up on this
so quickly. I apologize on the behalf of everyone involved in Go for a long time
to forget that this specific language goal needs to keep being communicated better.
Sun, Sep 25, 2016
New to the Go tools? Or do you want to expand your knowledge? This article is
about the flags for the Go tools everyone should know.
Disclaimer: This article might be slightly biased. This is a collection of
flags I personally use and flags people around me having trouble finding references for.
If you have more ideas, ping me on Twitter.
$ go build -x
-x lists all the commands go build invokes.
If you are curious about the Go toolchain, or using a cross-C compiler and
wondering about flags passed to the external compiler, or suspicious about
a linker bug; use -x to see all the invocations.
$ go build -x
WORK=/var/folders/00/1b8h8000h01000cxqpysvccm005d21/T/go-build600909754
mkdir -p $WORK/hello/perf/_obj/
mkdir -p $WORK/hello/perf/_obj/exe/
cd /Users/jbd/src/hello/perf
/Users/jbd/go/pkg/tool/darwin_amd64/compile -o $WORK/hello/perf.a -trimpath $WORK -p main -complete -buildid bbf8e880e7dd4114f42a7f57717f9ea5cc1dd18d -D _/Users/jbd/src/hello/perf -I $WORK -pack ./perf.go
cd .
/Users/jbd/go/pkg/tool/darwin_amd64/link -o $WORK/hello/perf/_obj/exe/a.out -L $WORK -extld=clang -buildmode=exe -buildid=bbf8e880e7dd4114f42a7f57717f9ea5cc1dd18d $WORK/hello/perf.a
mv $WORK/hello/perf/_obj/exe/a.out perf
$ go build -gcflags
Used to pass flags to the Go compiler. go tool compile -help lists all
the flags that can be passed to the compiler.
For example, to disable compiler optimizations and inlining, you can use
the following the gcflags.
$ go build -gcflags="-N -l"
$ go test -v
It provides chatty output for the testing. It prints the test name,
its status (failed or passed), how much it took to run the test, any logs
from the test case, etc.
go test without the -v flag is highly quiet, I always use it with -v turned on.
Sample output:
$ go test -v context
=== RUN   TestBackground
--- PASS: TestBackground (0.00s)
=== RUN   TestTODO
--- PASS: TestTODO (0.00s)
=== RUN   TestWithCancel
--- PASS: TestWithCancel (0.10s)
=== RUN   TestParentFinishesChild
--- PASS: TestParentFinishesChild (0.00s)
=== RUN   TestChildFinishesFirst
--- PASS: TestChildFinishesFirst (0.00s)
=== RUN   TestDeadline
--- PASS: TestDeadline (0.16s)
=== RUN   TestTimeout
--- PASS: TestTimeout (0.16s)
=== RUN   TestCanceledTimeout
--- PASS: TestCanceledTimeout (0.10s)
...
PASS
ok  	context	2.426s
$ go test -race
Go’s race detector is available
from the Go tools via -race. go test also supports this flag and reports races.
Use this flag during development to detect the races.
$ go test -run
You can filter tests to run by regex and the -run flag. The following command
will only test examples.
$ go test -run=Example
$ go test -coverprofile
You can output a cover profile as you are testing a package, then use go tool to
visualize them on a browser.
$ go test -coverprofile=c.out && go tool cover -html=c.out
The command above will create a coverage profile and open the results page in
the browser. The visualized results will look like the page below:

$ go test -exec
It is a lesser known feature in Go that you can intercept the tools with another
program by using the -exec flag. This flag allows you to delegate some work to an
external program from the Go tool.
A commonly required scenario for this flag is when you need more than just executing
the tests on the host machine. The Android builder for Go, uses -exec to push the
test binaries to an Android device by using adb and collects the results.
Android exec program
can be used as a reference.
$ go get -u
If you run go-get for a package that is already in your GOPATH, go-get
is not going to update the package to its latest version.
-u forces the tool to sync with the latest version of the repo.
If you are a library author, you might like to write your installation
instructions with a -u flag, e.g. the way golint does.
$ go get -u github.com/golang/lint/golint
$ go get -d
If you just want to clone a repo to your GOPATH and skip the building
and installation phase, use -d. It downloads the package and stops
before trying to build or install it.
I often use it as a replacement for git clone for repos with vanity URLs,
because it clones the repo to its proper GOPATH.
For example,
$ go get -d golang.org/x/oauth2/...
will clone the package to $GOPATH/src/golang.org/x/oauth2. Given golang.org/x/oauth2 is a
vanity URL, go-getting the repo is useful rather than trying to figure out
where the actual repo is (go.googlesource.com/oauth2).
$ go get -t
If your package has additional dependencies for tests, -t will allow you to
download them during go-get.
If you don’t pass -t, go get will only download the dependencies for your non-test code.
$ go list -f
Allows you to list Go packages with a custom format. It is highly useful
for writing bash scripts.
The following command will print the dependencies of the runtime package:
go list -f '{{.Deps}}' runtime
[runtime/internal/atomic runtime/internal/sys unsafe]
More formatting ideas can be found at
Dave Cheney’s article on go list.
Thu, Sep 8, 2016
Go programming language provides many unique good features to
write and maintain examples for your packages backed by the testing tools.
As an addition to the test coverage and test coverage report, go test
also can provide coverage for testable examples.
Use the following commands in your package to use the
-run flag to only the match the example tests and view the results
in your browser.
$ go test -v -run=Example -coverprofile=c.out && go tool cover -html=c.out
Please note that the coverage is reported for Examples with an Output block.
Examples without an “Output” block will not be tested and reported.
Here is what the coverage looks like
for the strings package from the stdlib.
High example coverage is probably not a necessary signal
and not all lines are supposed to be documented with an example
but it might give you an idea whether you are missing out a significant
non-obvious case that needs to be documented
more comprehensively.
Tue, Sep 6, 2016
With Go 1.7, testing package supports sub-tests that allows you to run
multiple smaller tests from a test case. Each sub test is reported
independently in the go test output. More information about these
recent additions can be found at Marcel van Lohuizen’s recent talk
from GolangUK 2016.
These additions to Go 1.7 enabled reporting and other testing.T
functionality for subtests. One of the biggest contributions of the
recent changes is to be able to use these features for table-driven tests.
The other important feature it enables is to be able to parallelize the
subtests (where makes sense) by using (*testing.T).Parallel().
func TestFoo(t *testing.T) {
	tc := []struct {
		dur time.Duration
	}{
		{time.Second},
		{2 * time.Second},
		{3 * time.Second},
		{4 * time.Second},
	}
	for _, tt := range tc {
		tt := tt
		t.Run("", func(st *testing.T) {
			st.Parallel()
			time.Sleep(tt.dur)
		})
	}
}
The test suite above will run roughly in 4 seconds rather than 10 seconds.
TestFoo#01, TestFoo#02, TestFoo#03 and TestFoo#04 will begin at the same
time, will wait for tt.dur and be completed.
$ go test -v
=== RUN   TestFoo
=== RUN   TestFoo/#00
=== RUN   TestFoo/#01
=== RUN   TestFoo/#02
=== RUN   TestFoo/#03
--- PASS: TestFoo (0.00s)
    --- PASS: TestFoo/#00 (1.00s)
    --- PASS: TestFoo/#01 (2.00s)
    --- PASS: TestFoo/#02 (3.00s)
    --- PASS: TestFoo/#03 (4.00s)
PASS
ok  	hello/subtests	4.020s
If you have table driven that are free from races and are majorly blocked
by anything other than your CPU, consider parallelizing them with the new sub tests.
Fri, Sep 2, 2016
Apple has a suite of instrumentation and tracing tools for performance
analysis available as a part of their Xcode tooling set. In this article,
we will use Instruments
to record and analyze the CPU profile of a Go program.
Instruments also provide a large set of macOS-specific tracing and profiling
if you have performance issues specifically on darwin.
Some of these specific profiles are:
- System trace: Collects comprehensive information about system calls,
scheduling, user-kernel space transitions. (Available only on OSX.)
- System usage: Gives very detailed output about I/O system activity.
(Available only on iOS.)
- File Activity: Monitors file and directory activity such as open/close,
permission modifications, creation, copying and moving.
Instruments provide a rich and very easy to use UI to display profiles.
I highly recommend it as an addition to existing profiler UIs and visualizers.
Now, let’s profile a Go program.
Launch the Instruments app and select “Time Profiler”.
Create a target with your Go binary and arguments and env variables
you want to start the binary with. In this tutorial, I will use the
following program.
go get -u github.com/rakyll/hey
We will use hey to make 10000 requests with 200 goroutines
to the target provided in the arguments.
The target I have for hey looks like what’s below.

Once you have a target, you can click on the record button to start
recording samples. Once enough samples are collected, stop or it will
eventually stop when the program finishes.

You can filter by symbol name, user vs kernel callstacks, time span,
physical or logical CPU and more. You can also double click any of the symbols listed
to jump to the source code.
Please note that Go programs cannot work with every profile available
on Instruments. But there are a few profiles that absolutely can improve
your profiling experience. With stack frame pointers enabled by default in Go 1.7,
it became easier for tools like Instruments to capture backtraces more efficiently.
Happy profiling!
Tue, Aug 30, 2016
Disclaimer: This article is not about a core Go package or tool but gRPC.
gRPC provides support for implementing streaming endpoints as well as
streaming support in their clients. Bidirectional streaming is useful
if you want both server and client to be able to communicate
to the other side independently in a full duplex fashion.
In this article, I will dig into how to use the streaming gRPC
Go client to talk to a streaming API endpoint.
I am not expecting the readers to implement a server, hence I will use an
existing service.
Google has recently released the Cloud Speech API
which allows its users
to caption their audio input. Speech API also supports a bidirectional
streaming endpoint where you can sent audio data continuously as you are
waiting on more responses from the server on another incoming channel.
Initialize a client:
stream, err := speech.NewSpeechClient(conn).StreamingRecognize(ctx)
if err != nil {
    log.Fatal(err)
}
We want to pipe the stdin to the API as we are printing the results.
Therefore, we will need two goroutines, one sending audio data to the
service and another retrieving the results.
The program will read from os.Stdin into an intermediate buffer and
will immediately push the buffer to the service.
go func() {
    // pipe stdin to the API
    buf := make([]byte, 1024)
    for {
        n, err := os.Stdin.Read(buf)
        if err == io.EOF {
            return // nothing else to pipe, kill this goroutine
        }
        if err != nil {
            // TODO: handle the error
            continue
        }
        if err = stream.Send(&speech.StreamingRecognizeRequest{
            StreamingRequest: &speech.StreamingRecognizeRequest_AudioContent{
                AudioContent: buf[:n],
            },
        }); err != nil {
            // TODO: handle the error
        }
    }
}()
At the same time, the program will start reading the responses in the
main goroutine and print the captions as service pushes them:
for {
    resp, err := stream.Recv()
    if err == io.EOF {
        break
    }
    if err != nil {
        // TODO: handle the error
        continue
    }
    if resp.Error != nil {
        // TODO: handle the error
        continue
    }
    for _, result := range resp.Results {
        fmt.Printf("result: %+v\n", result)
    }
}
The full reference is living in a gist
where you can learn more about the initializing of the gRPC connection and more.
Please note that the same pattern of sending and receiving can be applied to
work with any gRPC bidirectional streaming client.
Sat, Aug 27, 2016
If you are willing to make large scale refactoring in your
Go programs, automating the refactoring tasks is more desirable than
manual editing. eg is a program that allows you to perform transformations
based on template Go files.
To install the tool, run the following:
$ go get golang.org/x/tools/cmd/eg
eg requires a template file to look for which transformation it should
apply to your source code. What’s nice is that the template file is a Go file
with little annotations.
Consider the following Go program:
$ cat $GOPATH/src/hello/hello.go
package hello

import "time"

// ExtendWith50000ns adds 50000ns to t.
func ExtendWith50000ns(t time.Time) time.Time {
	return t.Add(time.Duration(50000))
}
Assume you want to eliminate the unnecessary time.Duration casting at ExtendWith50000ns
and as a good practice, you would also like to add a unit to the duration rather than
just passing 50000.
eg requires a template file where you define before and afters that represents the
transformation.
$ cat T.template
package template

import (
    "time"
)

func before(t time.Time, d time.Duration) time.Time {
    // if already time.Duration, do not cast.
    return t.Add(time.Duration(d))
}

func after(t time.Time, d time.Duration) time.Time  {
    return t.Add(d * time.Nanosecond)
}
And run the eg command on your hello package to apply it at every occurrence of this pattern.
$ eg -w -t T.template hello
=== /Users/jbd/src/hello/hello.go (1 matches)
Voila!
The file now contains a duration that is not casted unnecessarily and it has a unit.
$ cat $GOPATH/src/hello/hello.go
package hello

import "time"

// ExtendWith50000ns adds 50000ns to t.
func ExtendWith50000ns(t time.Time) time.Time {
	return t.Add(50000 * time.Nanosecond)
}
Note: There are many .template files
underneath the package for testing purposes but they can also be used as a
reference how to write other transformation templates.
Sat, Oct 3, 2015
Note: Swift bindings are highly experimental and subject to change.
This work must currently be classified as preliminary work and we will
be improving APIs in the long term.
As a part of the Go Mobile, we have announced tools and packages that
make language bindings from Java to Go and Objective-C to Go available.
A relatively new and less documented aspect of the bindings is the
availability of the Swift to Go calls. This tutorial will explain you
how to make your initial Swift to Go function invocation.
Grab the gomobile command and initialize it.
$ go get golang.org/x/mobile/cmd/gomobile
$ gomobile init
In this tutorial, we will use an example Go package from the mobile repo
called hello to generate bindings for. The hello package exports a function
called Greetings and we will invoke this particular function from a
Swift-based iOS app. Go get the example hello package and run gomobile bind
to generate a framework bundle.
$ go get golang.org/x/mobile/example/bind/hello/...
$ gomobile bind -target=ios golang.org/x/mobile/example/bind/hello
The command above is going to generate a bundle called Hello.framework on the
current working directory which includes a multi-arch C library and a header file.
The next step is to launch Xcode and open your existing Swift-based iOS app project.
Drag and drop the Hello.framework to the project.
This step will also automatically make the framework library linked to the final app product.

Once the framework bundle is imported, you are good to import the
Hello module and invoke GoHelloGreetings which is a proxy function for
hello.Greetings.
import UIKit
import Hello
class ViewController: UIViewController {
    override func viewDidLoad() {
        super.viewDidLoad()
        println(Hello.GoHelloGreetings("gopher"))
    }
    override func didReceiveMemoryWarning() {
        super.didReceiveMemoryWarning()
    }
}
Build and run it on your test device or the iOS simulator.
Enjoy making your first call to Go from Swift. Please note that this is
preliminary work and we would like to make changes to improve the APIs in the long term.
More information and tutorials about Go Mobile are available at
the wiki.
Tue, Sep 8, 2015
Note: This article extends Dave Cheney’s Go 1.5 cross compilers post.
Cross compilers got easier with Go 1.5.
You don’t have to bootstrap the standard library and toolchain as you
used to do prior to 1.5.
If cgo is not required
The go tool won’t require any bootstrapping if cgo is not required.
That allows you to target the following program to any GOOS/GOARCH without
requiring you to do any additional work. Invoke go build.
$ cat main.go
package main
import "fmt"
func main() {
    fmt.Println("hello world")
}
In order to target android/arm, run the following command.
$ GOOS=android GOARCH=arm GOARM=7 go build .
The produced binary is targeting ARMv7 processors that runs Android.
All possible GOOS and GOARCH values are listed on the environment docs.
If cgo is required
If you need to have cgo enabled, the go tool allows you to provide
custom C and C++ compilers via CC and CXX environment variables.
$ CGO_ENABLED=1 CC=android-armeabi-gcc CXX=android-armeabi-g++ \
    GOOS=android GOARCH=arm GOARM=7 go build .
The toolchain will invoke android-armeabi-gcc and android-armeabi-g++
if it is required to compile any part of the package with a C or C++ compiler.
Consider the following program with a slightly different main function.
Rather than outputting “hello world” to the standard I/O,
it will use Android system libraries to write “hello world” to the system log.
$ cat main.go
// +build android

package main

// #cgo LDFLAGS: -llog
//
// #include <android/log.h>
//
// void hello() {
//   __android_log_print(
//     ANDROID_LOG_INFO, "MyProgram", "hello world");
// }
import "C"
func main() {
    C.hello()
}
If you build the program with the command above and examine the build
with -x, you can observe that cgo is delegating the C compilation to
arm-linux-androideabi-gcc.
$ CGO_ENABLED=1 \
CC=arm-linux-androideabi-gcc \
CXX=arm-linux-androideabi-g++ \
GOOS=android GOARCH=arm GOARM=7 go build -x .
...
CGO_LDFLAGS=”-g” “-O2” “-llog” /Users/jbd/go/pkg/tool/darwin_amd64/cgo -objdir $WORK/github.com/rakyll/hello/_obj/ -importpath github.com/rakyll/hello — -I $WORK/github.com/rakyll/hello/_obj/ main.go
arm-linux-androideabi-gcc -I . -fPIC -marm -pthread -fmessage-length=0 -print-libgcc-file-name
arm-linux-androideabi-gcc -I . -fPIC -marm -pthread -fmessage-length=0 -I $WORK/github.com/rakyll/hello/_obj/ -g -O2 -o $WORK/github.com/rakyll/hello/_obj/_cgo_main.o -c $WORK/github.com/rakyll/hello/_obj/_cgo_main.c
...
Pre-building the standard library
The go tool also provides a utility if you would like to pre-build the
standard library, targeting a specific GOOS and GOARCH.
$ CGO_ENABLED=1 \
    CC=arm-linux-androideabi-gcc \
    CXX=arm-linux-androideabi-g++ \
    GOOS=android GOARCH=arm GOARM=7 go install std
The standard library targeting android/armv7 will be available at $GOROOT/pkg/android_arm.
$ ls $GOROOT/pkg/android_arm
archive    fmt.a      math       runtime.a
bufio.a    go         math.a     sort.a
bytes.a    hash       mime       strconv.a
compress   hash.a     mime.a     strings.a
container  html       net        sync
crypto     html.a     net.a      sync.a
crypto.a   image      os         syscall.a
database   image.a    os.a       testing
debug      index      path       testing.a
encoding   internal   path.a     text
encoding.a io         reflect.a  time.a
errors.a   io.a       regexp     unicode
expvar.a   log        regexp.a   unicode.a
flag.a     log.a      runtime
If you prefer not to pre-build and install the standard library to the GOROOT,
required libraries will be built while building user packages.
But, the standard libraries builds are not preserved for future use at this
stage and they will be rebuilt each time you run go build.
Sat, Oct 18, 2014
If there was a single powerful language feature in Go, it’d be the interfaces.
The internals of Go contain strong combinations of useful ideas from various type
systems and inevitably they ring the curiosity bells. I recently surveyed Github
for Go interface declarations, and the results indicated that Go users pollute
the environment with interfaces no one needs or will use.
Don’t export any interfaces until you have to.
Interfaces are great, but interface pollution is not so. You’re likely to come to
Go from a language (if not from a dynamic language) that generates a static dispatch
table during compilation, the compiler require you to explicitly tell the interfaces
a type wants to implement. That’s how the complier can generate a vtable with pointers
to all available virtual functions. If your background is in C++ or Java, you’re likely
to have some baggage around initiating your codebase with abstract types and work on the
concrete implementation as a follow-up exercise. This is not how you do it in Go.
Introduce concrete types and don’t export any interfaces unless you have to encourage
external packages to implement one. io package is a good starting point to study some
of the the best practices. It exports interfaces because it also needs to export
generic-use functions like Copy.
func Copy(dst Writer, src Reader) (written int64, err error)
Should your package export generic functionality? If the answer is a “maybe”,
you’re likely to be polluting your package with an interface declaration.
Justify the need of multiple implementations, likeliness of them to interact
back with your package and act accordingly.
Go doesn’t have a traditional dispatch table, and can rely on the interface values
during a method dispatch. It’s literally more of a freestyle dispatcher mechanism
that requires some work during interface value assignment — it generates a tiny lookup
hash-table for the concrete type it’s pointing to. The assignment is not insanely
expensive, so it’s a fair exchange for a more pleasant type system.
Ian Lance Taylor has a great blog post about the internals
if you’re looking for further reading.
If a user requires some level of “inversion of control”, an on-the-fly interface
definition in their own scope would just work. This possibility minimizes the
presumptions you have to make about the way your package is being consumed and
the initial abstractions you have to work on.
It also applies to the testability concerns, you don’t have to provide interfaces
to help the user to write their own stubs. Earlier today, I got a request to export
an interface from the pubsub package to make it more mockable. Rather than doing so,
the preferable way is to tell your user to introduce an interface that focuses on the
calls they want to write a stub for. Point to the actual implementation via an interface value.
type acknowledger interface {
    Ack(sub string, id ...string) error
}

type mockClient struct{}

func (c *mockClient) Ack(sub string, id ...string) error {
    return nil
}

var acker acknowledger = pubsub.New(...)

acker = &mockClient{} // in the test package
Noteworthy that, in Go, the standard library defines tiny interfaces you happen to
implement without effort and is doing a good job at encouraging the developers to write
compatible code with the rest of the standard library — and the other third party packages.
Adopt what’s available in the standard library where possible and document accordingly.
Go fascinates me each time I deeply reevaluate my experience with the interfaces.
Given the chance of minimal fragmentation in interfaces, this is how a programming
language make software, that isn’t designed to work together, work well together.

